Being Right About AI Could Still Lose You a Fortune
AI is the most consequential technology we have ever invented and it will help us automate all boring work, solve diseases, and enrich our lives.
But it can be an extraordinary technology and a huge net benefit to humanity while still being dramatically overfunded at a particular moment in time, like it is now.
We shouldn’t be oblivious to the financial reality.
The AI boom has a simple financial problem: trillions in spending is growing much faster than billions in revenue.
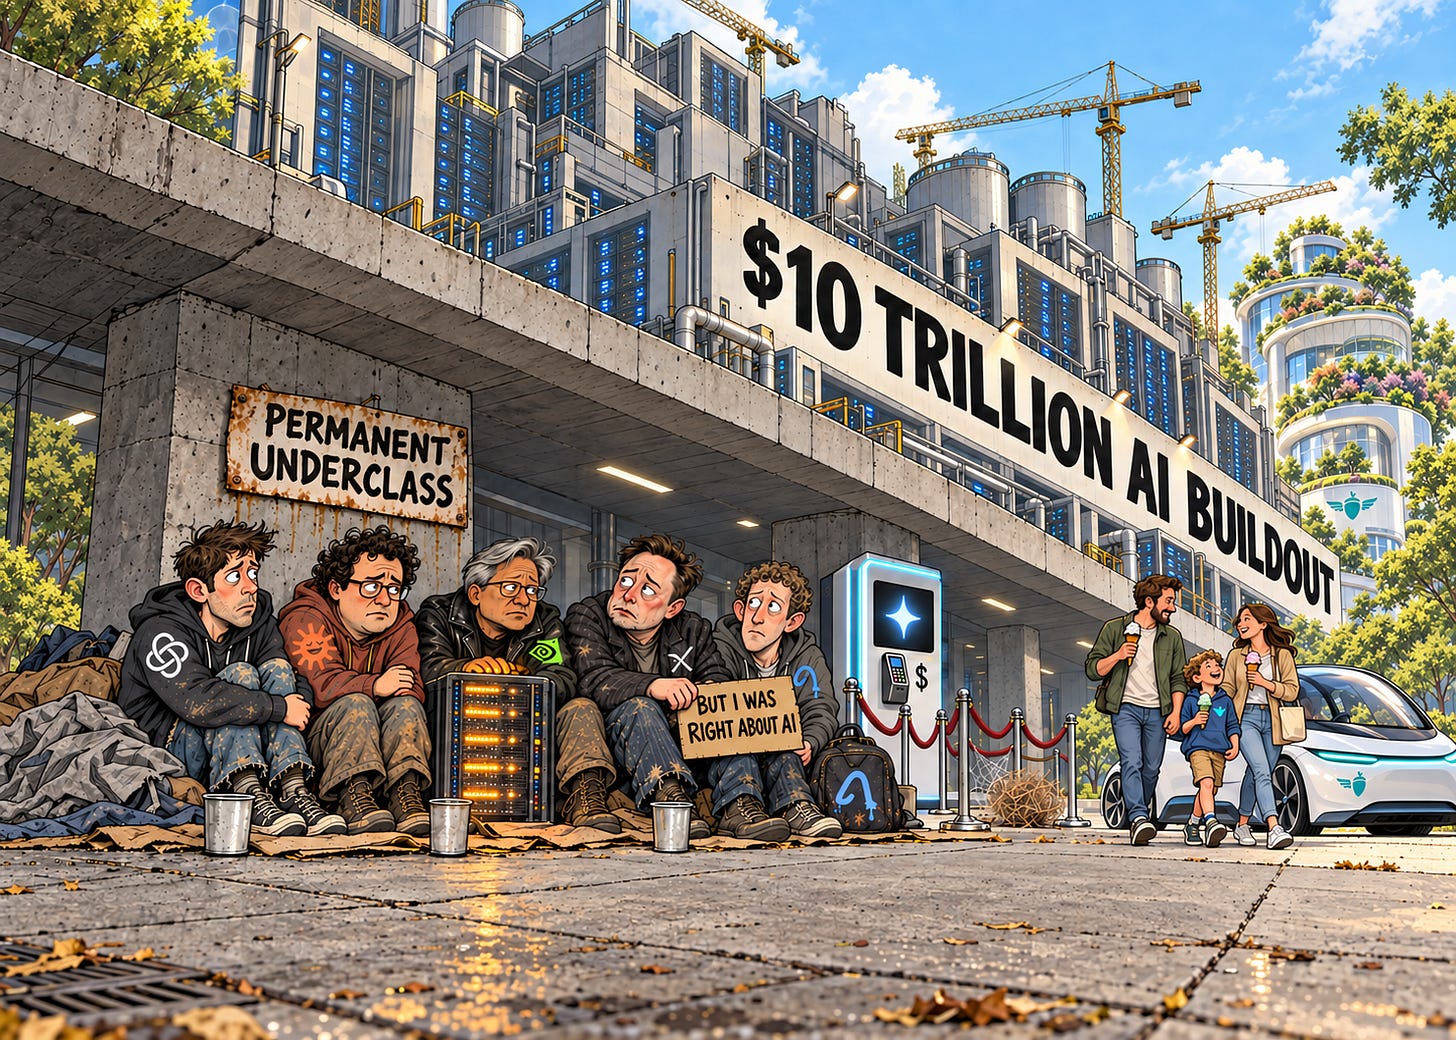
Summary:
-
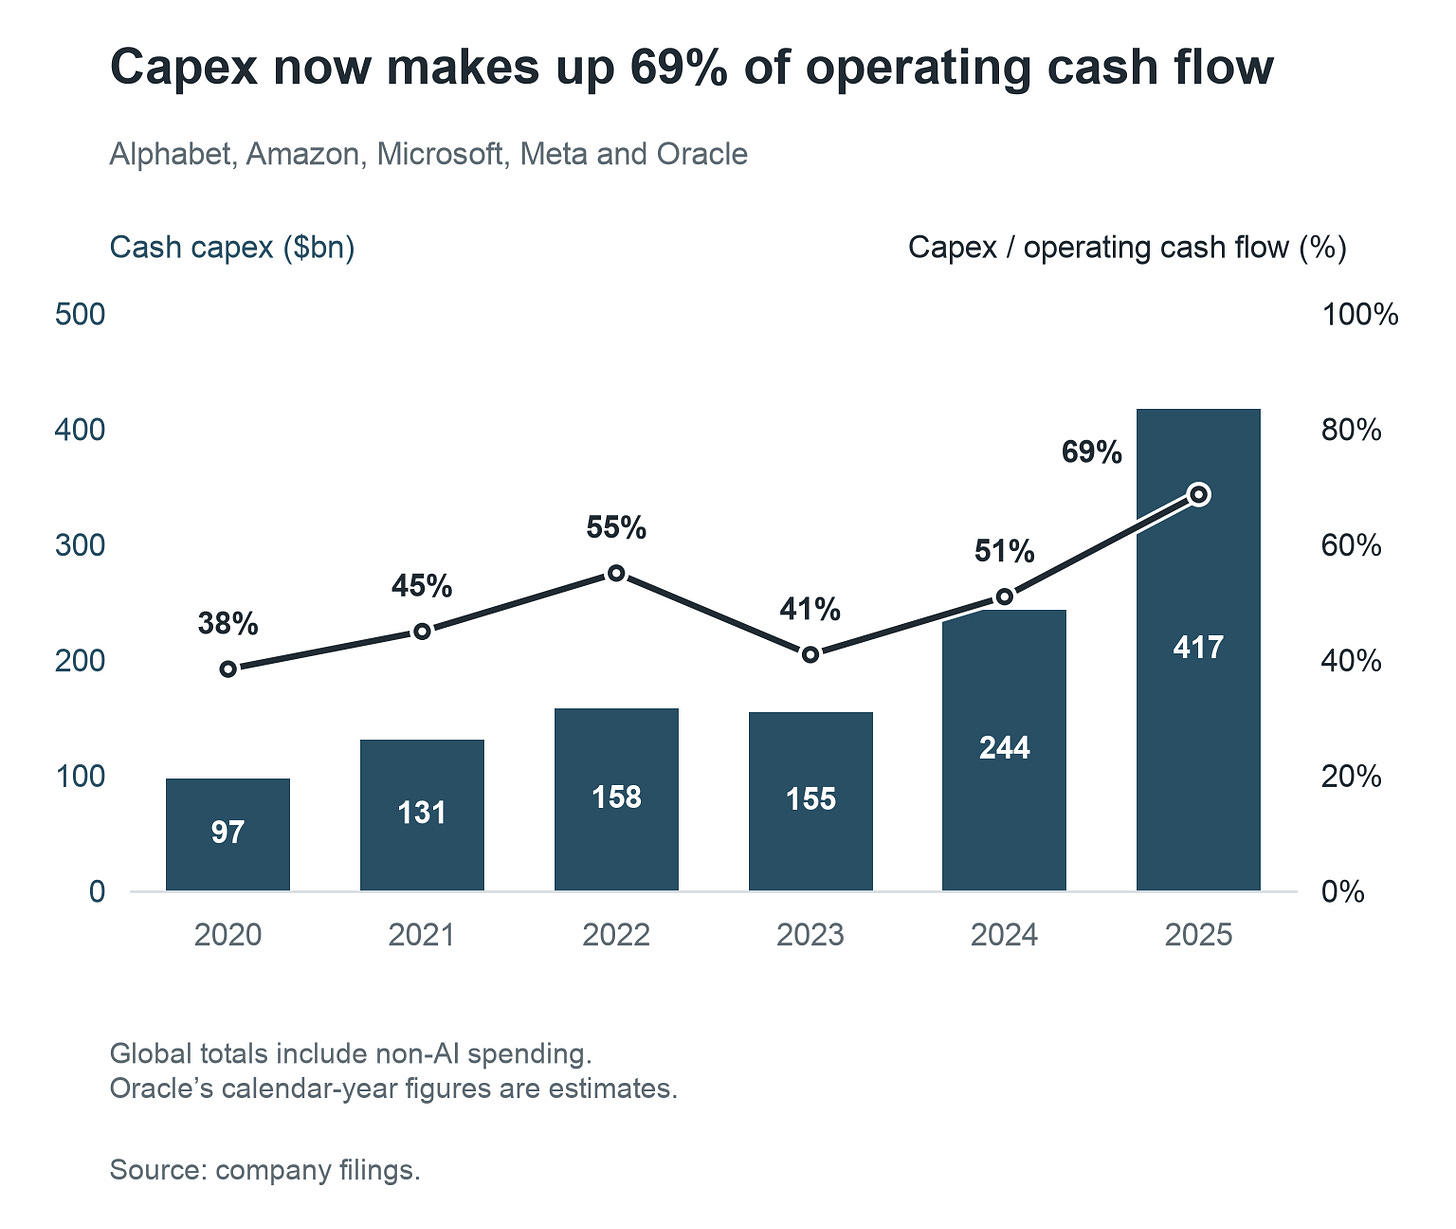
Big Tech’s capital expenditure (“capex”) has roughly quadrupled between 2020 and 2025 while revenue has only doubled. Capex now consumes 69% of operating cash flow up from 38% in 2020, and another ~$10 trillion investment is expected over the next five years.
-
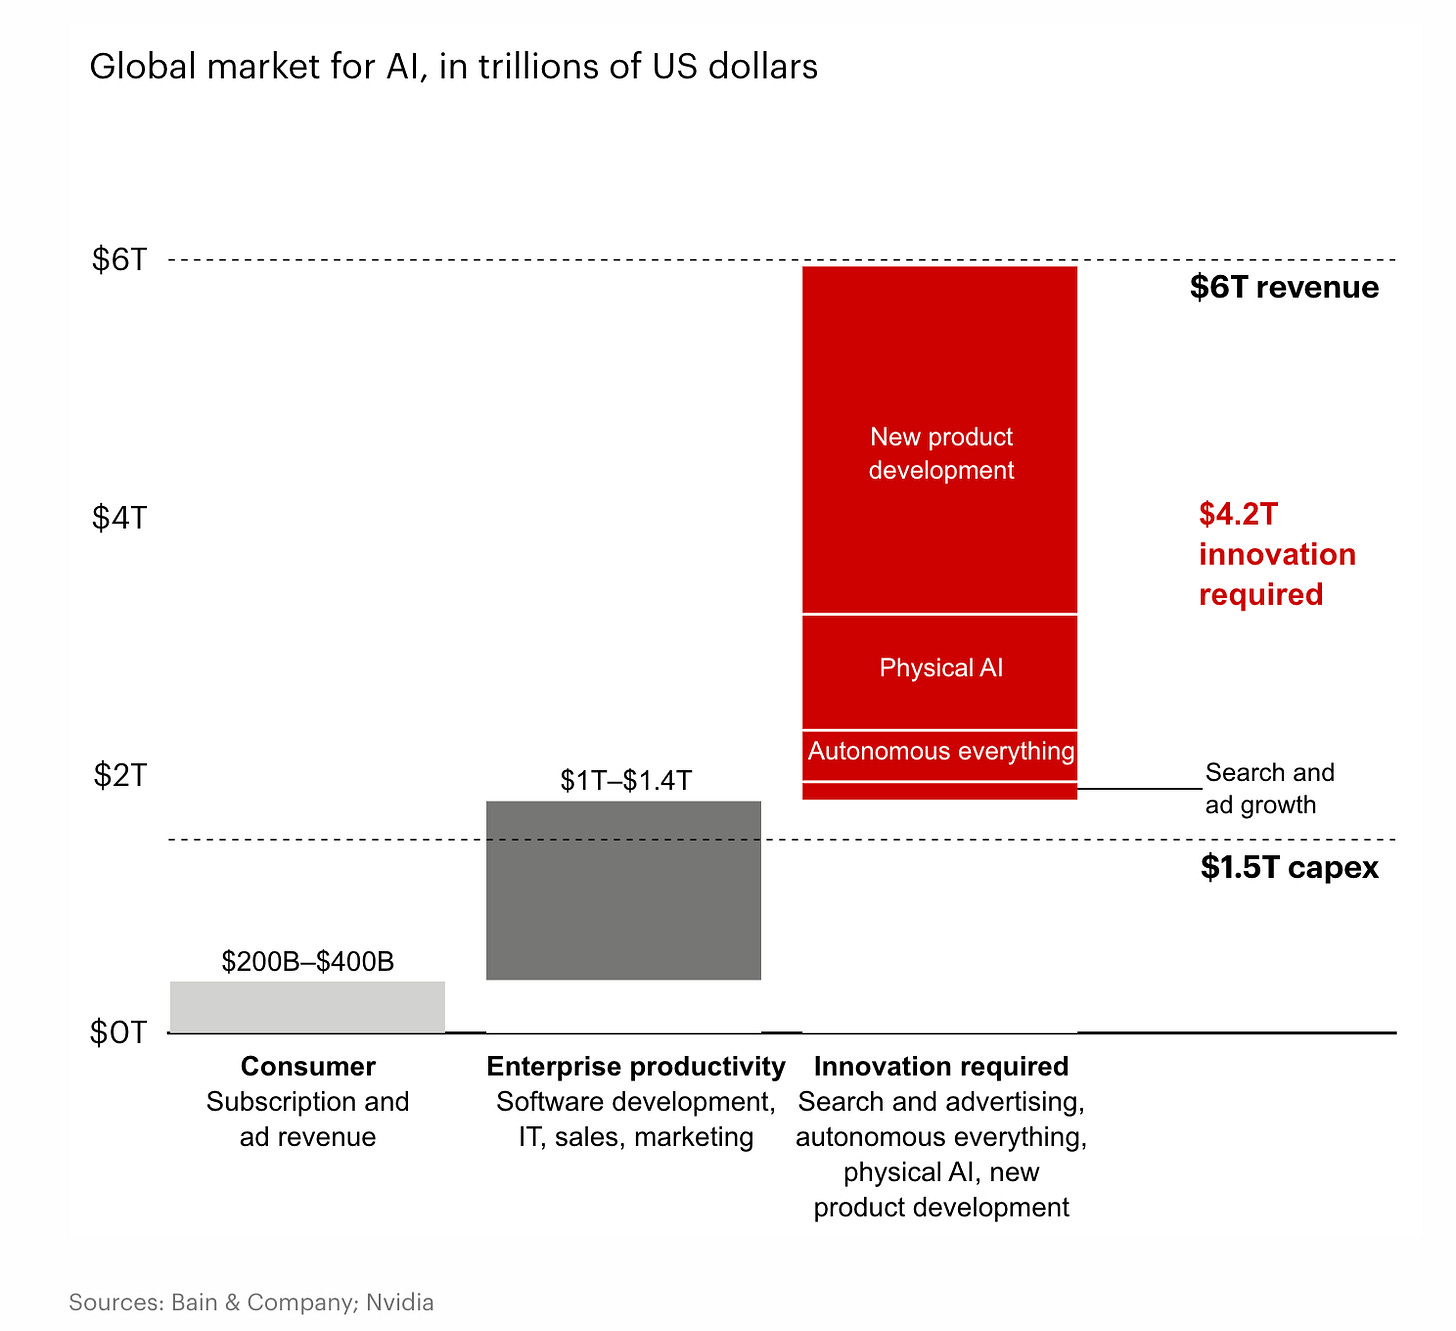
For investors to earn a reasonable return on that spending, AI needs to generate an enormous amount of new revenue. My rough estimate is at least $6 trillion per year. Bain independently arrived at a similar number (breakdown below) and estimates that +$4 trillion of it does not exist yet.
-
$6 trillion is an extraordinary amount of economic activity. It is larger than Germany’s GDP and equivalent to creating another 15 hyperscalers. If consumers ultimately fund much of that growth, their incomes and spending would have to rise dramatically. And consumer confidence would have to recover from the historical lows it is currently at.
-
Timing matters almost as much as the eventual payoff. If AI creates the required economic value five years later than expected, the time value of money means the required payoff becomes trillions of dollars larger.
-
The companies driving the AI buildout still need huge amounts of outside capital. Anthropic has at least $518bn of supplier commitments over a decade. OpenAI reportedly forecasts $278bn of cash burn across 2026–2030, even with annual revenue reaching $350bn by 2030. Meanwhile, OpenAI has ruled out a 2026 IPO and Anthropic’s timetable has also slipped.
-
Stocks are near record highs, but the market is jittery with multiple IPOs cancelled or delayed in the last few months. If public markets cannot supply the funding and private capital or customer revenue can’t fill the gap, some prominent AI companies could fail.
-
There is an obvious historical parallel here.
-
During the telecom boom, Iridium spent about $5.7bn building a satellite phone network but attracted too few paying customers. It went bankrupt less than a year after launch. New owners bought the assets for $25m and restarted the service, with far less investment to recover.
-
Global Crossing built fibre-optic networks as internet usage grew, but excess capacity drove prices down. It went bankrupt, and its original shareholders were wiped out.
-
$10 trillion will be spent on AI capex in just 5 years
McKinsey and Goldman Sachs predict $8 trillion of AI infrastructure spending over 5 year periods ending in 2030 and 2031. SemiAnalysis projects an $11 trillion buildout between 2024 and 2029.1
The companies funding AI are committing a much larger share of their businesses’ cash to capex than previously. Alphabet, Amazon, Microsoft, Meta and Oracle increased annual capex from $97 billion in 2020 to $417 billion in 2025.
Their combined revenue only doubled over those years while capex more than quadrupled. In 2025, capex consumed 69% of their operating cash flow, up from 38% in 2020.
Capex is incurred to generate future returns for the business. At this scale, the timing of the returns is important.
That’s what I am going to model in the following sections, assuming a $10 trillion buildout.
A $10 trillion buildout would need to earn about $6 trillion revenue a year
I wanted to know what the AI buildout would have to earn to justify the money going into it.
So I came up with a simple earnings test which works backwards from the cash:
-
Invest $100 today.
-
Receive $20 at the end of each year for ten years.
-
Those payments repay the investment and deliver roughly a 15% annual return.
Now scale that up to the AI buildout:
-
Count the $10 trillion as spent upfront.
-
Receive ten equal annual cash payments, starting one year later.
-
Assume no further investment and nothing left to sell after year ten.
Actual spending and earnings would be spread over time; this is just a simple test to give us a benchmark range.
Alphabet, Amazon, Microsoft, Meta and Oracle together generated operating cash flow equal to 36% of their revenue in 2025. That is a useful starting point to convert cash into revenue (though it includes their non-AI businesses).
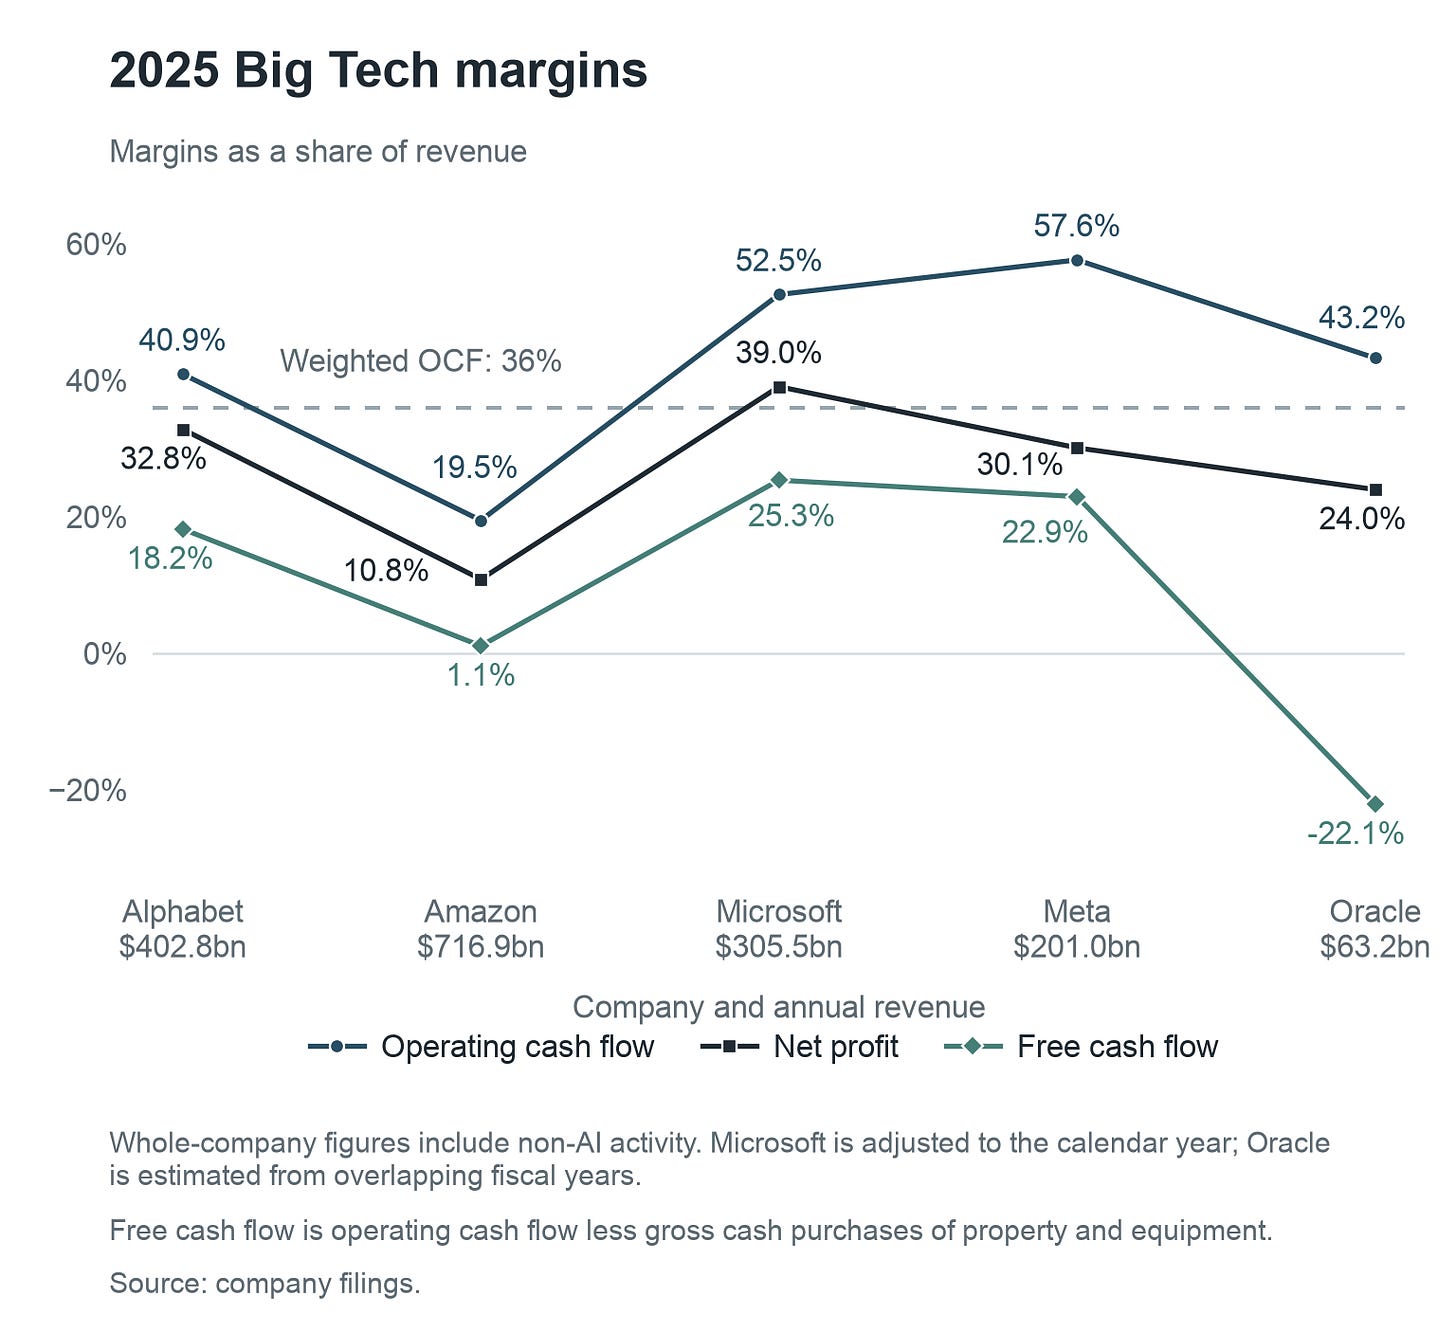
At 35% cash margin and a 15% IRR, earning $2 trillion in annual cash required by the test takes $5.7 trillion in annual revenue. Every year for ten years.
This is equivalent to creating 15 more hyperscalers.
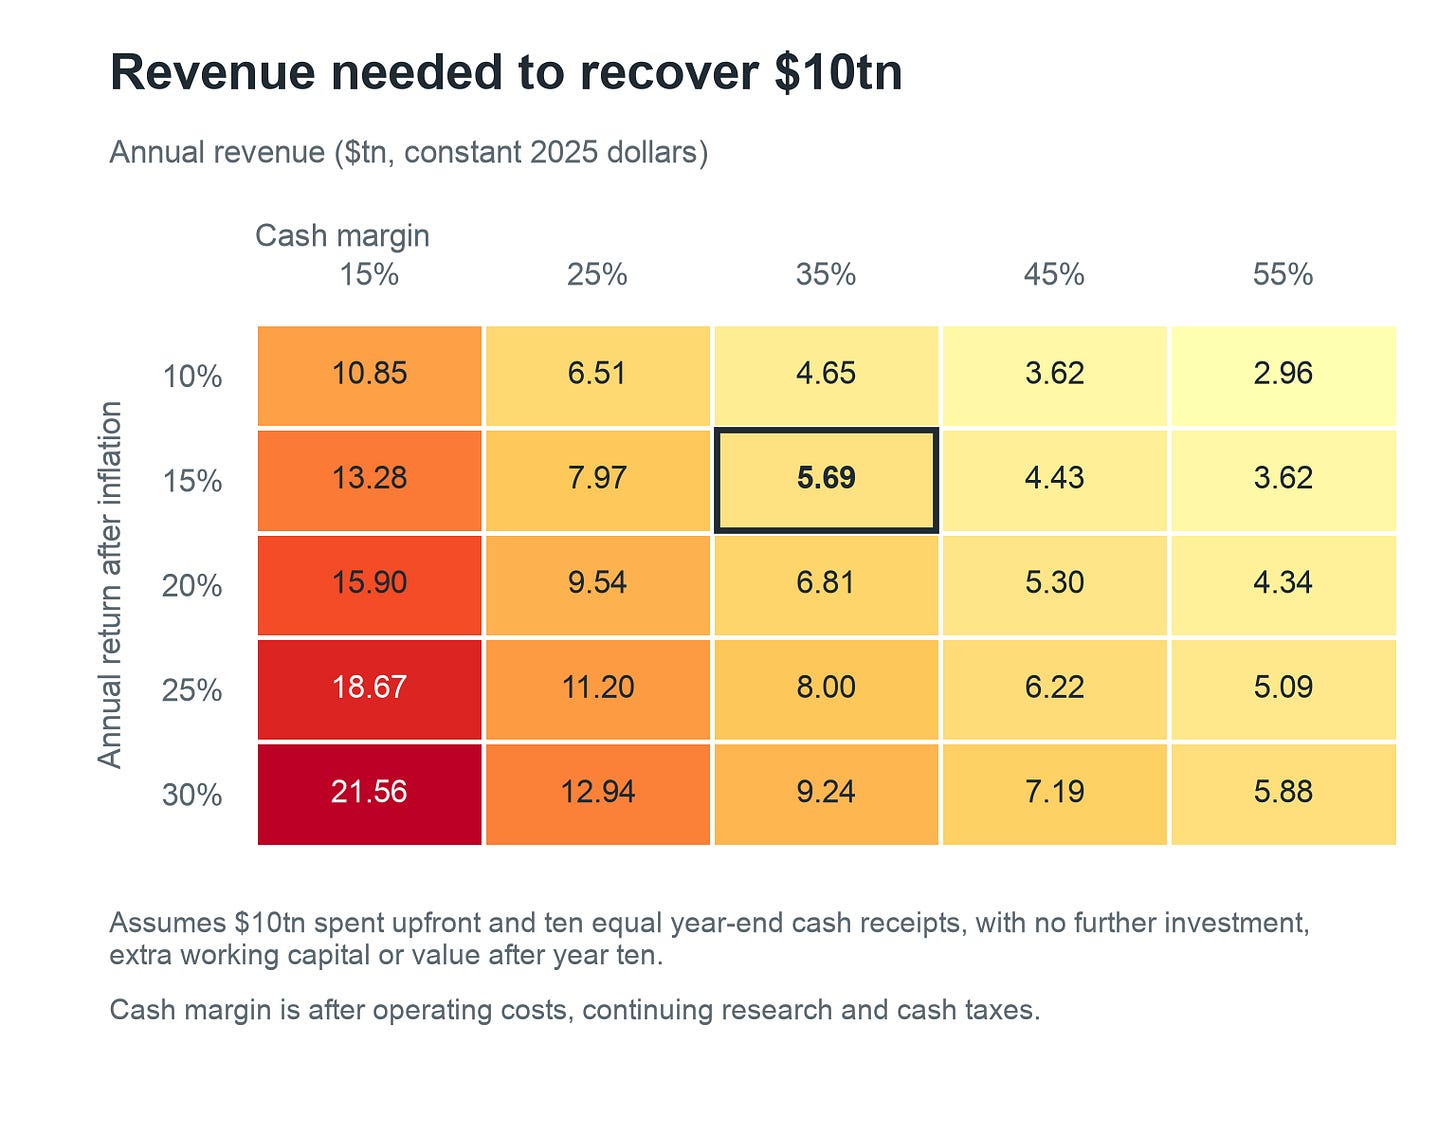
It’s useful sense checking the scale of these revenue numbers.
In a report published this week, Bain also arrived at $6 trillion annual revenue, through a different methodology.2
Obviously, an investor can sell their shares at a profit before the business earns this money. But the earnings test answers whether and how fast the business earns enough to justify what has been paid for it in upfront capex?
$6 trillion is the size of Germany’s entire economy
At this scale of revenue, we have to look beyond just company earnings to the economy.
If you are Salesforce in the 2010s, you can project your revenue without thinking about the broader economy. But when there are multiple AI companies together projecting trillions in revenue, the demand in the economy becomes an important variable because consumers might not buy trillions worth of new products.
The US’ GDP was $31 trillion in 2025, Germany’s GDP was $5.1 trillion. The revenue we need is larger than Germany’s entire annual output.3
We have got used to people throwing big numbers around. For example, one might say “If Elon is worth a trillion dollars, we only need six Elons.”
But Elon’s wealth is a stock: value accumulated and held at a point in time. Revenue is a flow: money coming in over a period of time. Six Elons would give us a lot of wealth.
But we need customers spending $6 trillion every year. And then spending it again the next year to sustain that annual revenue.
The same distinction applies to the stock market. If rising share prices add $6 trillion to the value of AI companies, that does not mean customers have spent $6 trillion on AI or the economy has produced $6 trillion more. Investors have simply put a higher price on those businesses. The revenue we are talking about requires customers to spend $6 trillion buying AI products and services, every year. A higher valuation does not itself generate that spending.
GDP is a flow too: it’s the value an economy produces over a year, counting the value added at each stage, rather than adding up every invoice. In the US in 2025, the spending breakdown was roughly consumers (68%), government spending and investment (17%), private investment (18%), and exports (11%), less imports (14%).
It’s critical that what gets produced in the economy needs to find a buyer!
Sustaining $6 trillion of additional annual output means finding $6 trillion of spending on that output every year, whether for consumption or investment (but it’s mostly consumption).
Think of Anthropic charging Uber for using Claude Code, and Uber ultimately selling rides to consumers. Uber earns the money to pay its suppliers by selling rides. Ultimately, this chain depends on passengers willing and able to pay for transport.4
Now suppose passengers spend $100 on rides, and Uber pays $10 to Anthropic for AI that helps it build the app to provide those rides. The $10 is revenue for Anthropic and a cost for Uber. It is already part of what it takes to supply the passengers’ $100 purchase.
Adding Uber’s $100 to Anthropic’s $10 revenues gives us $110, but it doesn’t mean the economy produced $110 of final output. GDP counts the value added by each business, so the same output isn’t counted again every time money changes hands.
See how this is a GDP shaped problem with the circular revenue in the AI industry.
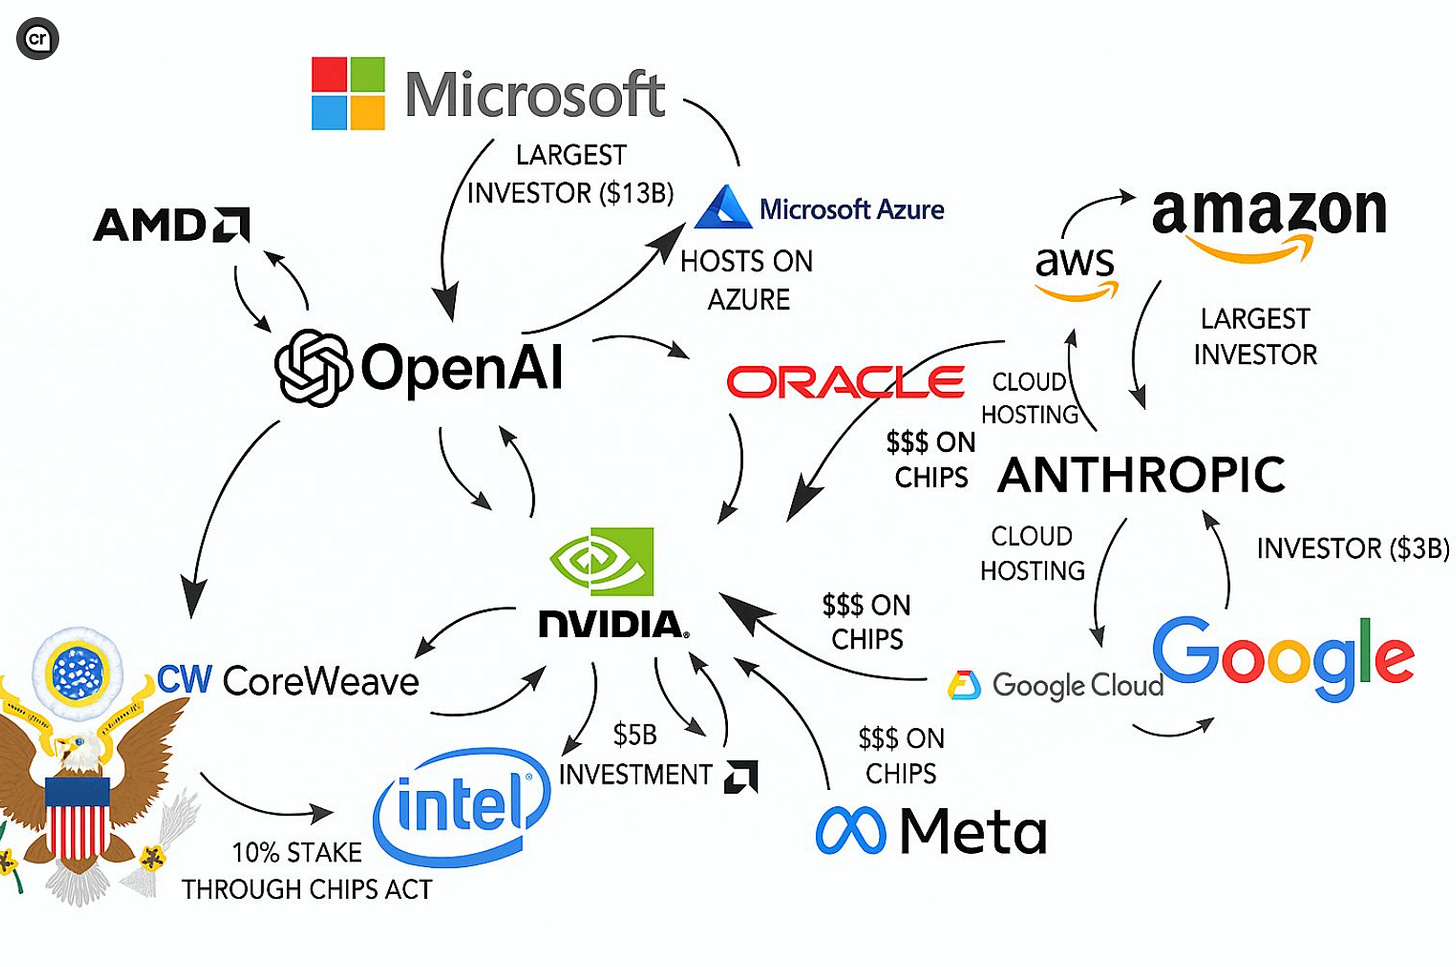
This next test is a simplified US only illustration of affordability at the end of ten years. It assumes all $5.7 trillion of annual AI customer spending is funded from additional US income. It’s not a direct conversion of global AI revenue into US GDP.
To work out how much economic growth could support this spending, let’s start with a $30 trillion US economy growing at 2% a year without the extra AI investment. In 10 years, the economy is at $37 trillion.
We should not credit the AI buildout with growth that would have happened any way given we spent $10 trillion to buy this growth. In practice, it won’t just be the US economy that grows but like I said, it’s a simulated test.
If we fund AI by cutting spending elsewhere, the affected businesses lose demand that was part of this baseline. We cannot leave their output untouched in the calculation and count the new AI spending on top.
The growth credited to AI in this scenario has to be net of the activity it displaces. Reallocated spending can still pay AI suppliers, while lower costs or better products can benefit customers. It simply does not establish the net extra GDP assumed in this test.
If every extra dollar of GDP supported a full dollar of AI spending, we would add almost $6 trillion to the GDP from the incremental AI spend.
That takes US GDP to about $42 trillion after ten years, requiring 3.5% annual real growth instead of 2%.
So far, we have assumed that all the extra income generated by economic growth goes towards buying AI. That leaves nothing from the increase for people and businesses to spend on anything else.
Suppose instead that they spend half their extra income on AI and half on other purchases. To afford $5.7 trillion of additional AI spending each year, they would need $11.4 trillion of additional annual income: $5.7 trillion for AI, and another $5.7 trillion for everything else. The 50–50 split is an assumption to illustrate how much the answer depends on AI’s share of that new spending.
Without the extra AI investment, our $30 trillion economy would grow to about $37 trillion after ten years. Adding $11.4 trillion takes it to roughly $48 trillion. Reaching that size would require 4.8% annual growth after inflation, compared with the baseline 2%.
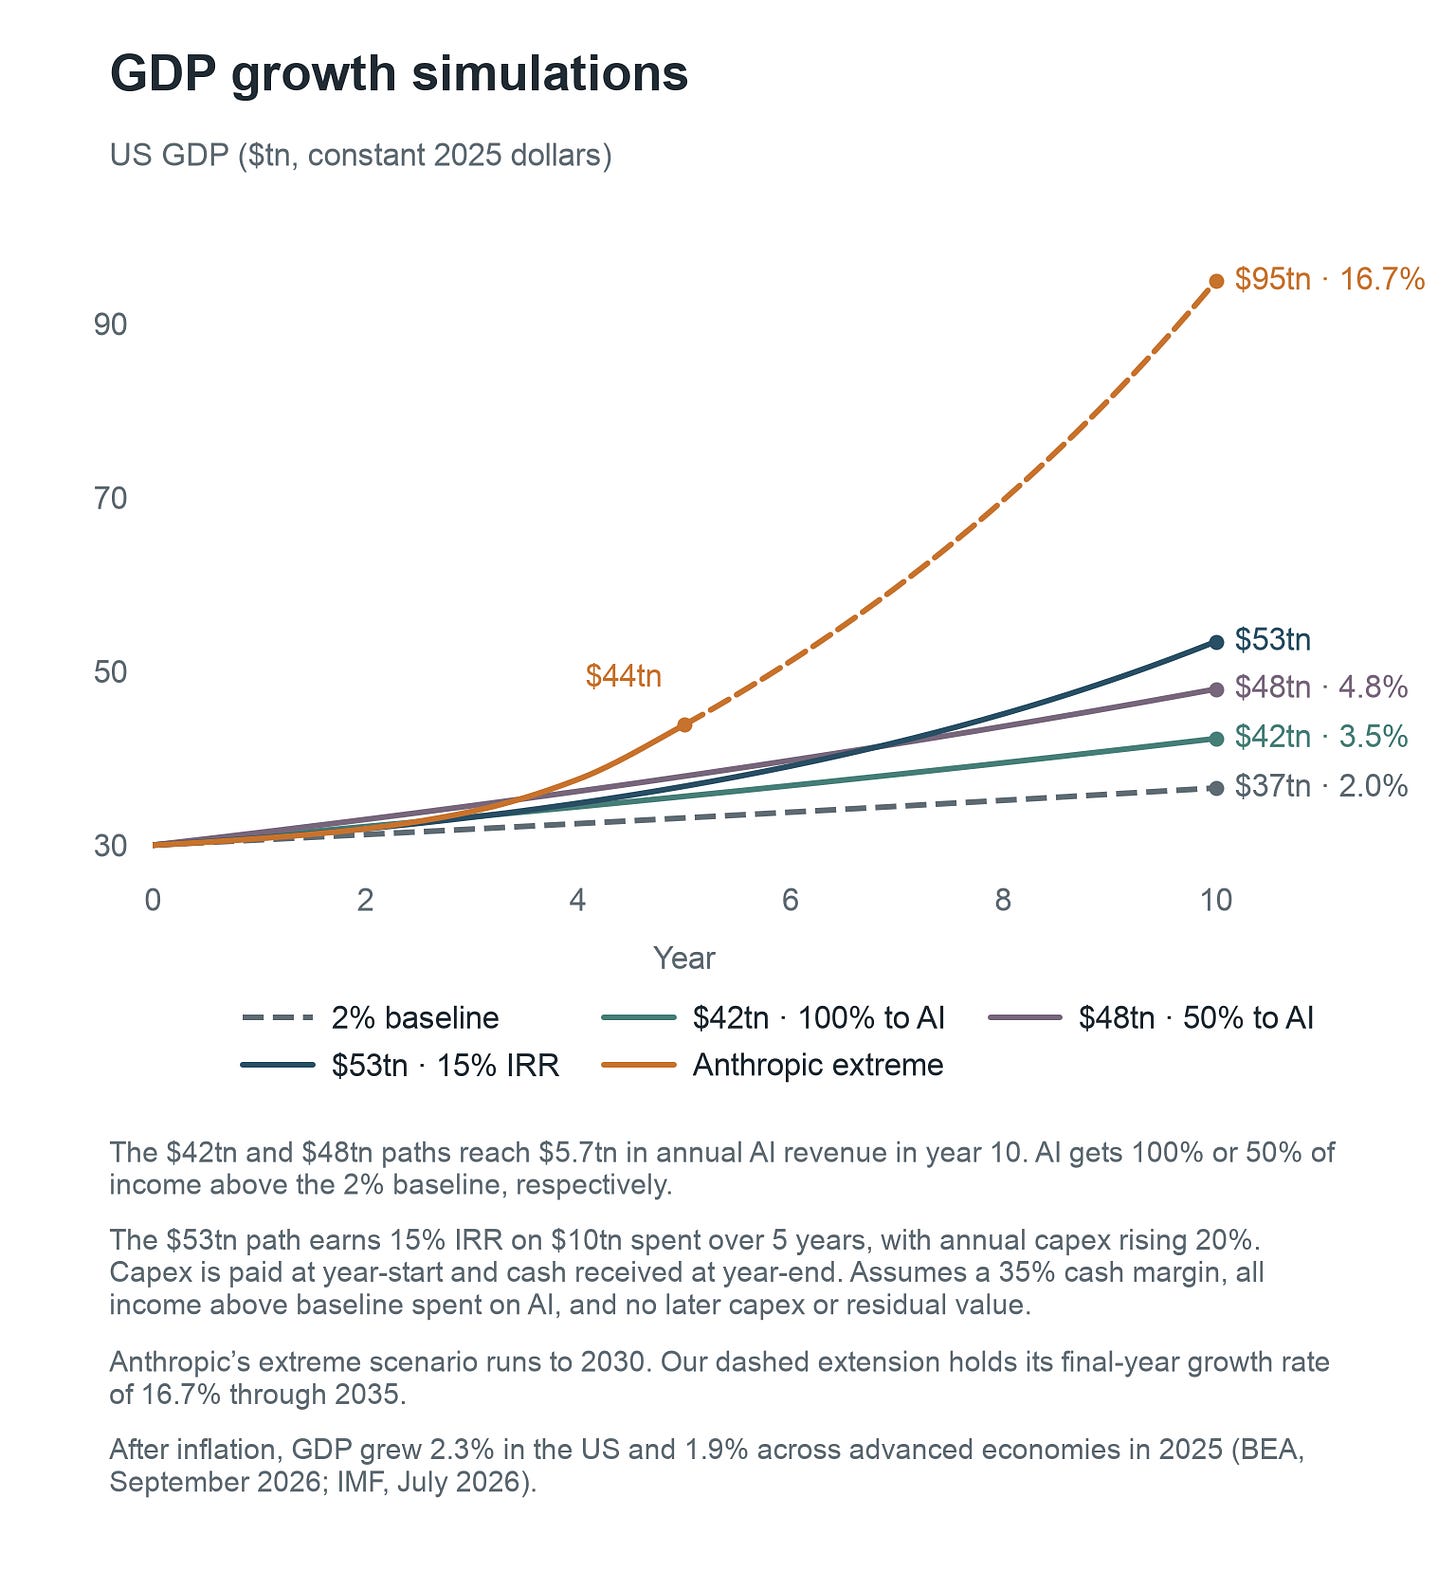
But reaching $6 trillion in annual revenue by year ten still leaves investors short in the early years. With earnings growing over the decade and capex spread over the first five years, our 15% return case needs US GDP to reach about $53 trillion by year ten.
By comparison, these returns simulations are still very shy of Anthropic’s extreme scenario (extended to ten years at its final growth rate).5
Think of the breakthroughs that emerged around 1870–1920: electric power, telephones, cars and airplanes. They transformed homes, factories and transport, helping create the modern world. But as Robert Gordon’s history, discussed by Jason Crawford, shows, their economic benefits spread over decades.
The current capex ramp requires AI to bring similarly far reaching changes into everyday use quickly enough to generate trillions of dollars of extra annual output in under a decade.
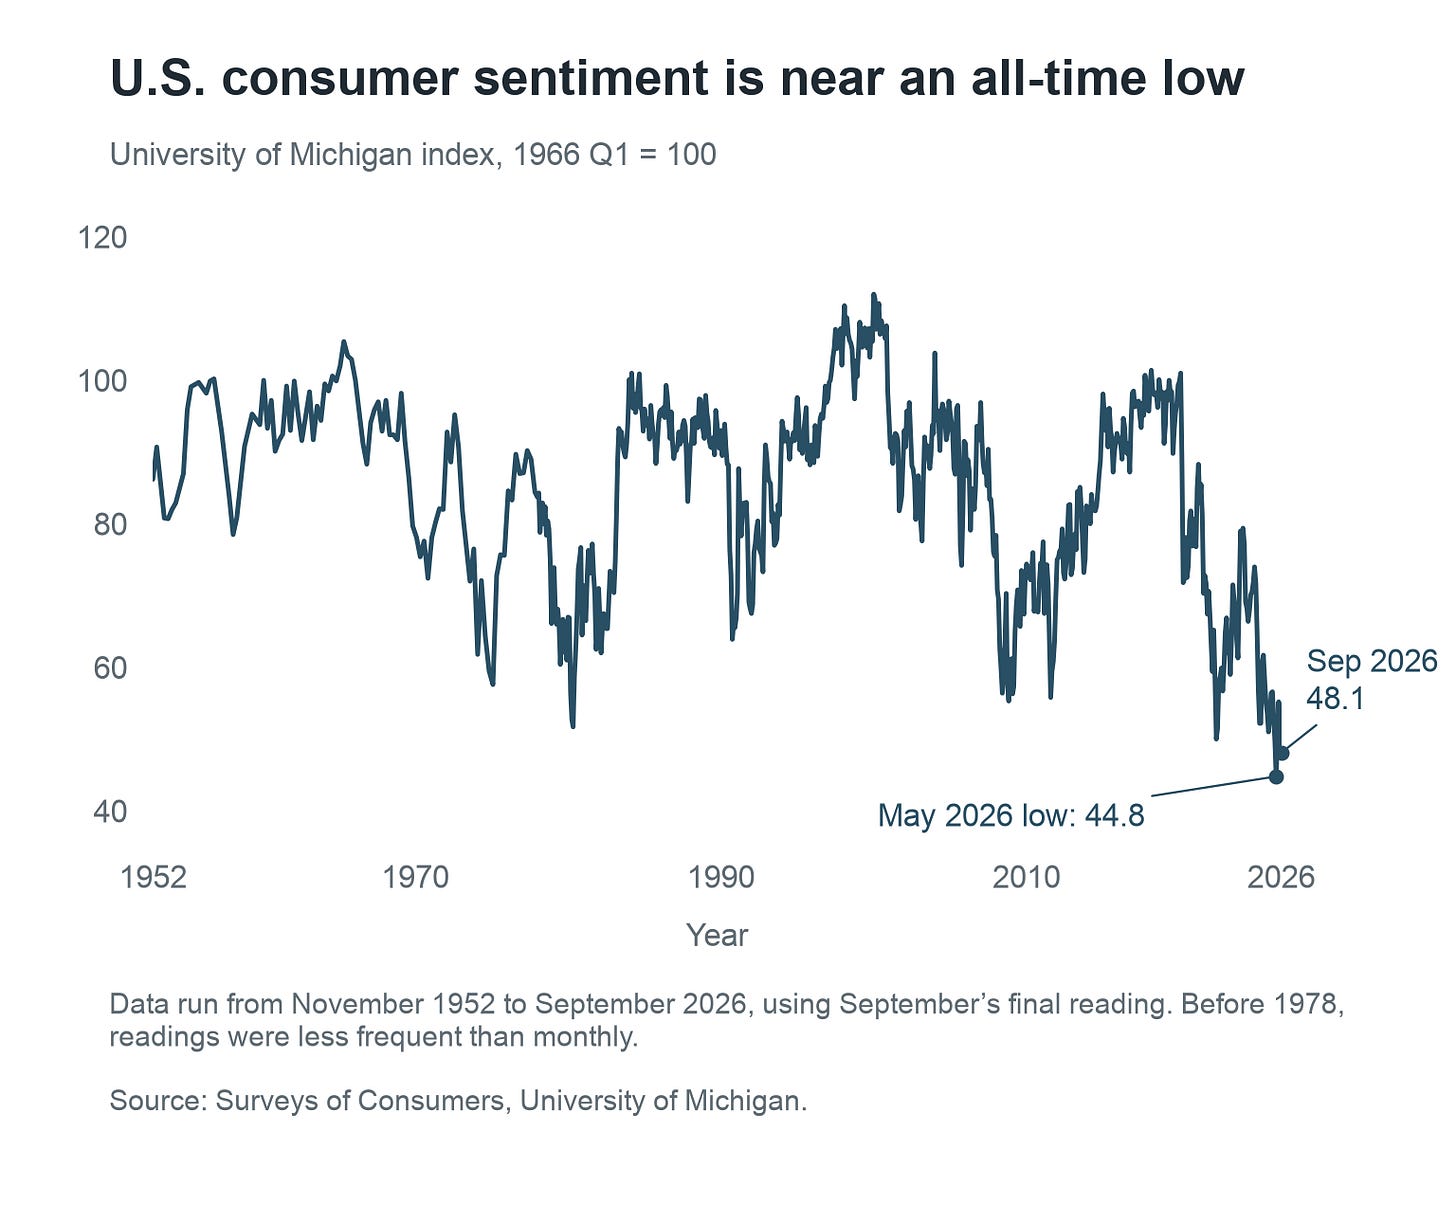
Consumer confidence is at an all time low, so why would they spend $6 trillion?
Consumer spending is equivalent to more than 2/3rds of US GDP.
If we expect consumers to spend for the AI bill, directly or through businesses like Uber, they need both the means and the willingness to spend.
Rising wages would help. Imagine a scenario where some of this growth reaches people’s paychecks. If wages rose in line with GDP in the modeled 4.8% annual growth scenario, someone who earns the average US wage of $76K today would earn $121K after 10 years, a 60% rise in real terms.
That would give households much more room to pay for AI, childcare, meals, travel and other services. Some of that pay rise would happen under the baseline growth assumption of 2%. The simulated AI scenario would add about $28K of annual purchasing power above that baseline.
This is how productivity gains could help fund the AI bill: customers have more money to spend, and so businesses earn more from serving them. How much of the expected growth reaches customers’ incomes matters enormously to spending.
Let’s compare this with the last 50 years of US earnings to understand if it’s feasible. Average annual earnings rose from about $41K in 1975 to $76K in 2025, after inflation. The largest ten-year increase in this published series, from 1991 to 2001, was about 27%.
A 60% rise in 10 years would be an exceptional decade for average pay. AI might make that possible, but recent history gives us little reason to assume that GDP growth will translate into gains of that size in workers’ paychecks.
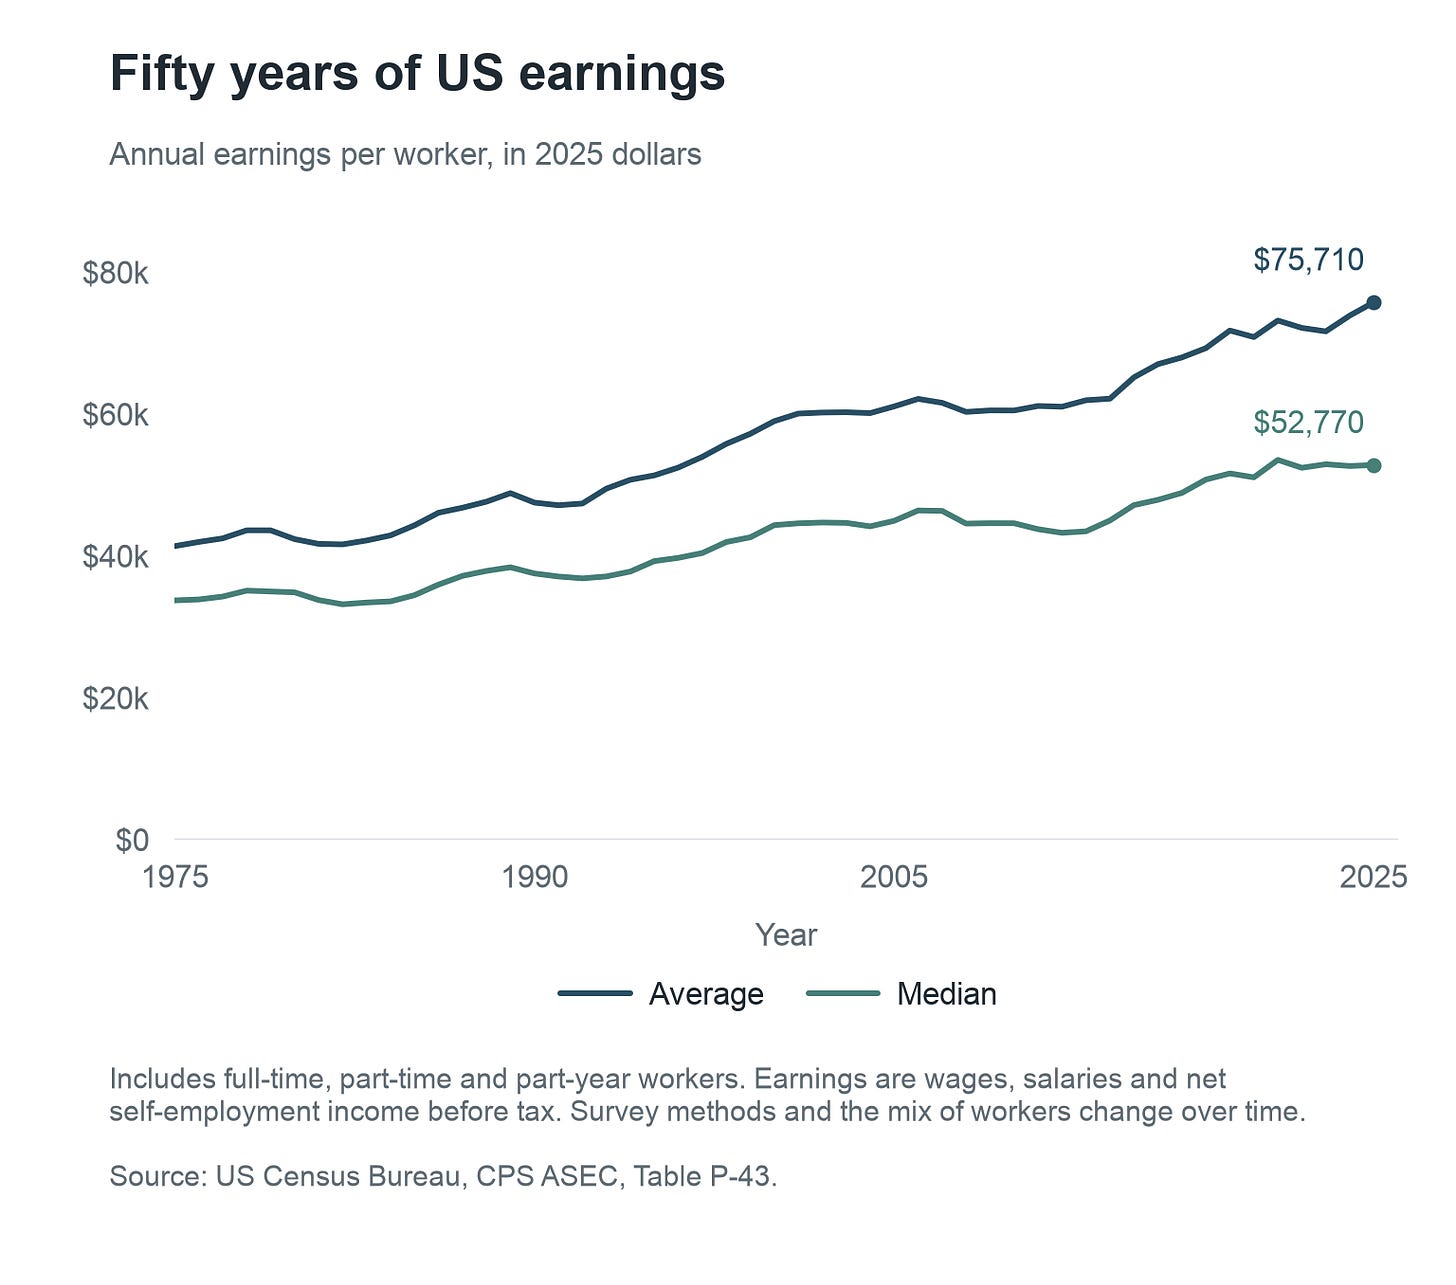
For a more recent comparison, from 2006 to 2023, US GDP grew by about 1.9% a year after inflation, while average wages grew by 0.8%. Globally, GDP grew by 2.7% a year and wages by 1.8%.
Wage growth in line with GDP growth is therefore well above all historical rates and trends. So how did consumer spending keep growing when pay per worker grew so much more slowly?
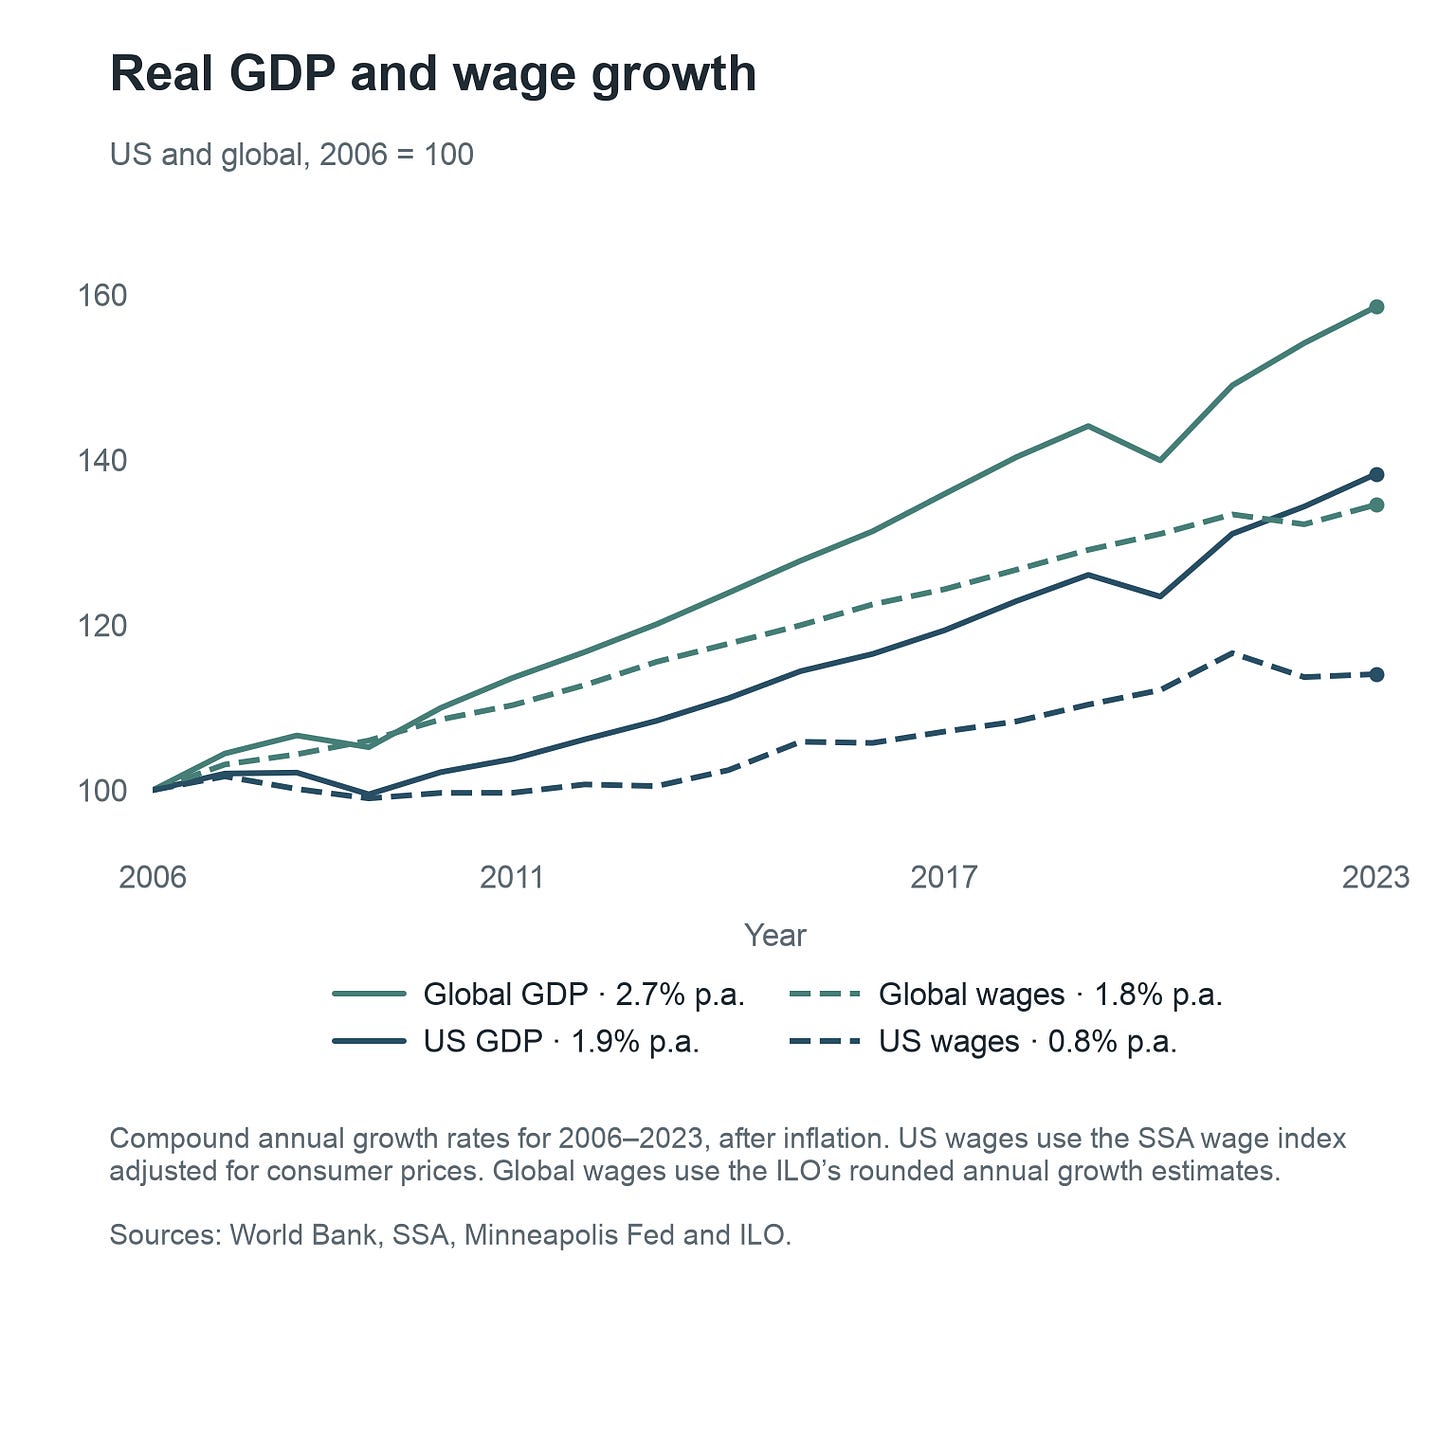
Over those seventeen years in the US, employment rose from 144 million to 161 million people. There were 17 million more people earning, and real GDP per employed person rose about 24%. The economy had both more workers and more output per worker, even though pay did not keep pace with the total increase in output.6
With the workforce expected to grow more slowly in the future, supporting much greater consumer spending will depend more on rising income per person; borrowing and drawing down savings are just a stopgap.
And, finally consumers have to be willing to spend. US consumer sentiment hit an all time low of 44.8 in May 2026 in the University of Michigan’s published series back to 1952. That is a weak starting point for a bet on consumers spending trillions more every year.7
Time value of money: a 5 year delay in AI adoption increases the bill by trillions
Suppose AI delivers the growth we’ve been asking for, and customers can afford to pay. We still need to ask when they start paying.
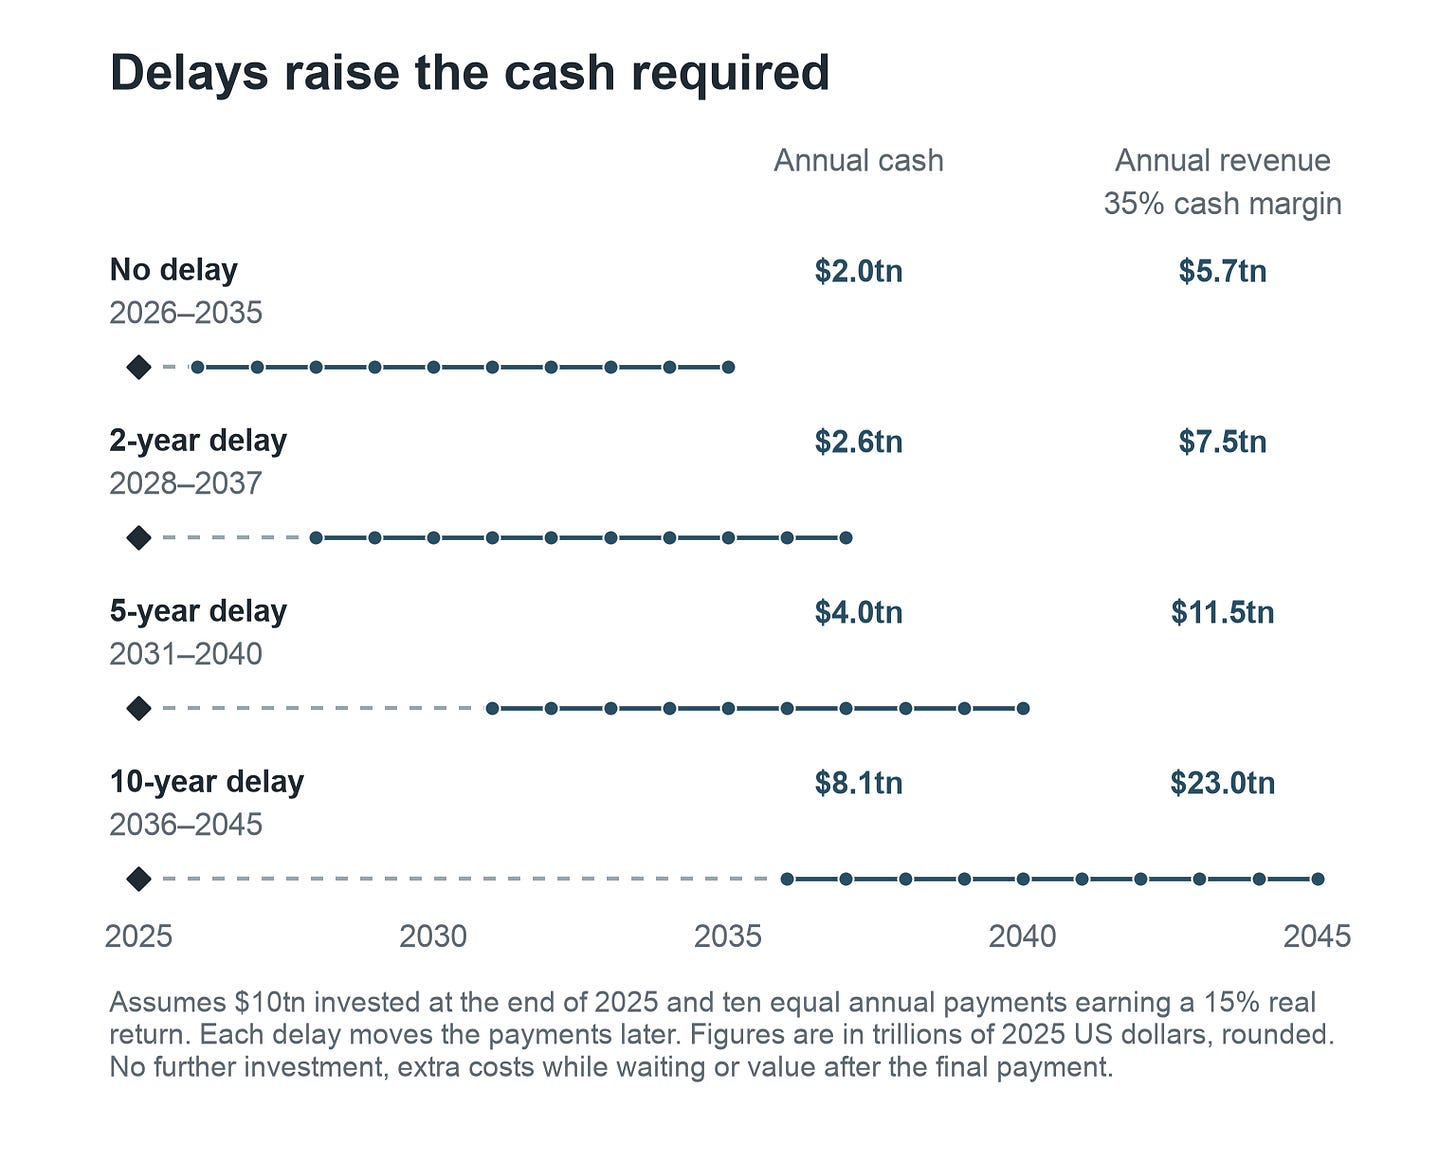
If we commit the same money today and receive the same cash earnings five years later, the annual return falls due to the time value of money.
Our original calculation assumes the $10 trillion fixed investment starts paying back a year after we spend it. $2 trillion in annual cash for ten years repays the investment and delivers the 15% annual return.
But if customers take five years longer to adopt AI, investors still spend the same money upfront and wait five extra years for every payment. Even if the business eventually earns all the cash we expected, the annual return falls to ~7%.
To still earn 15%, the business would have to compensate investors for that wait. It would need to return about $4 trillion in cash each year, roughly double the original amount, over its ten earning years. At our 35% cash margin, that means $11.5 trillion in annual revenue instead of $5.7 trillion.
This is an illustrative case to show that the longer AI adoption takes, the more customers eventually have to spend for today’s investment to earn the same returns.
You can believe that people will eventually spend this and more on AI while still doubting the financial return on building all the capacity now.
Infrastructure takes time to build, so some spending has to precede demand. But committing trillions earlier needs a financial case for what that head start will earn.
The company forecasts in the next section show how much customer growth the businesses already expect, and whether that growth is enough to pay for what they are building on the required timetable.
How many hundred billions in revenue per AI company to pay their own bills?
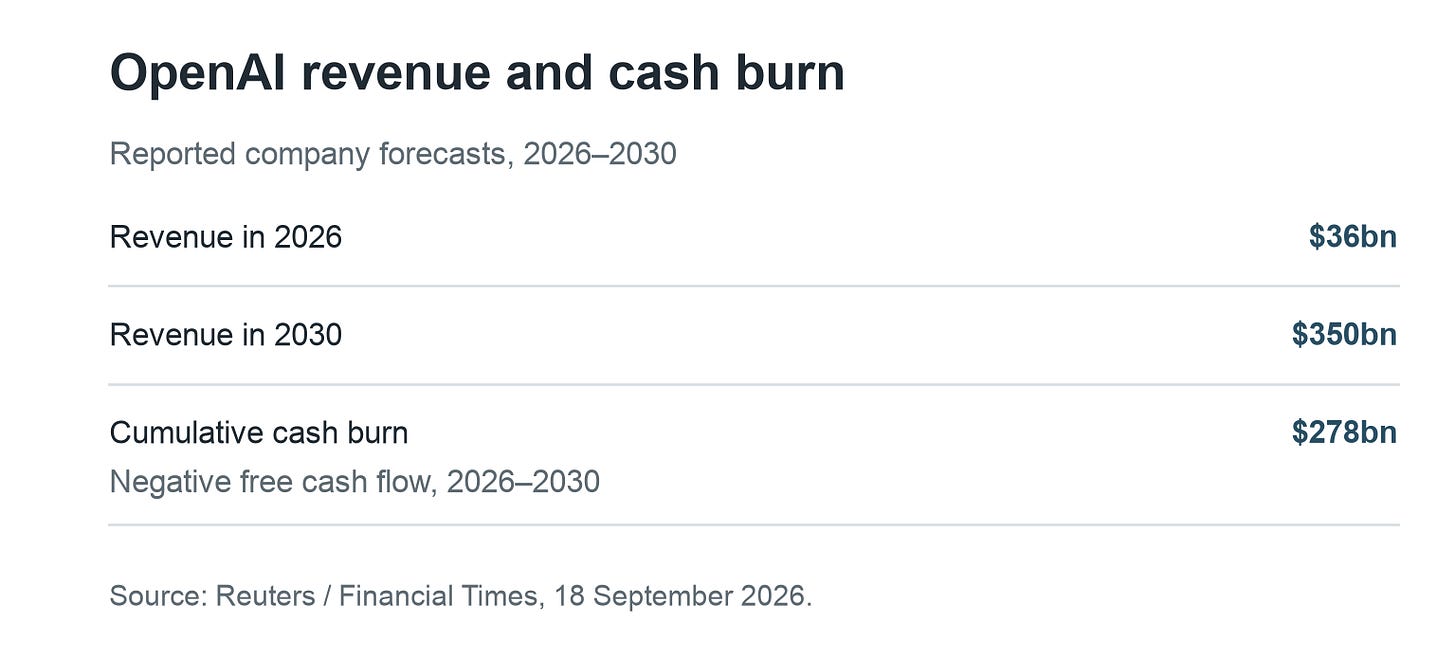
OpenAI expects $350 billion of annual revenue by 2030. That is an extraordinary business by any measure. The company also forecasts $278 billion of cumulative cash burn from 2026 to 2030.
Unlike traditional software businesses that thrived financially because of near zero marginal costs, every response/token served by OpenAI has a somewhat high direct cost made up of pesky, difficult to reduce in the short term components like GPU depreciation and electricity.
Let’s look at gross margins i.e. what remains from a customer’s revenue after the direct costs of delivering the product are paid. If those costs take $70 of every $100, the remaining $30 still has to pay for salaries, new model training, sales, interest on debt, capex, and more.
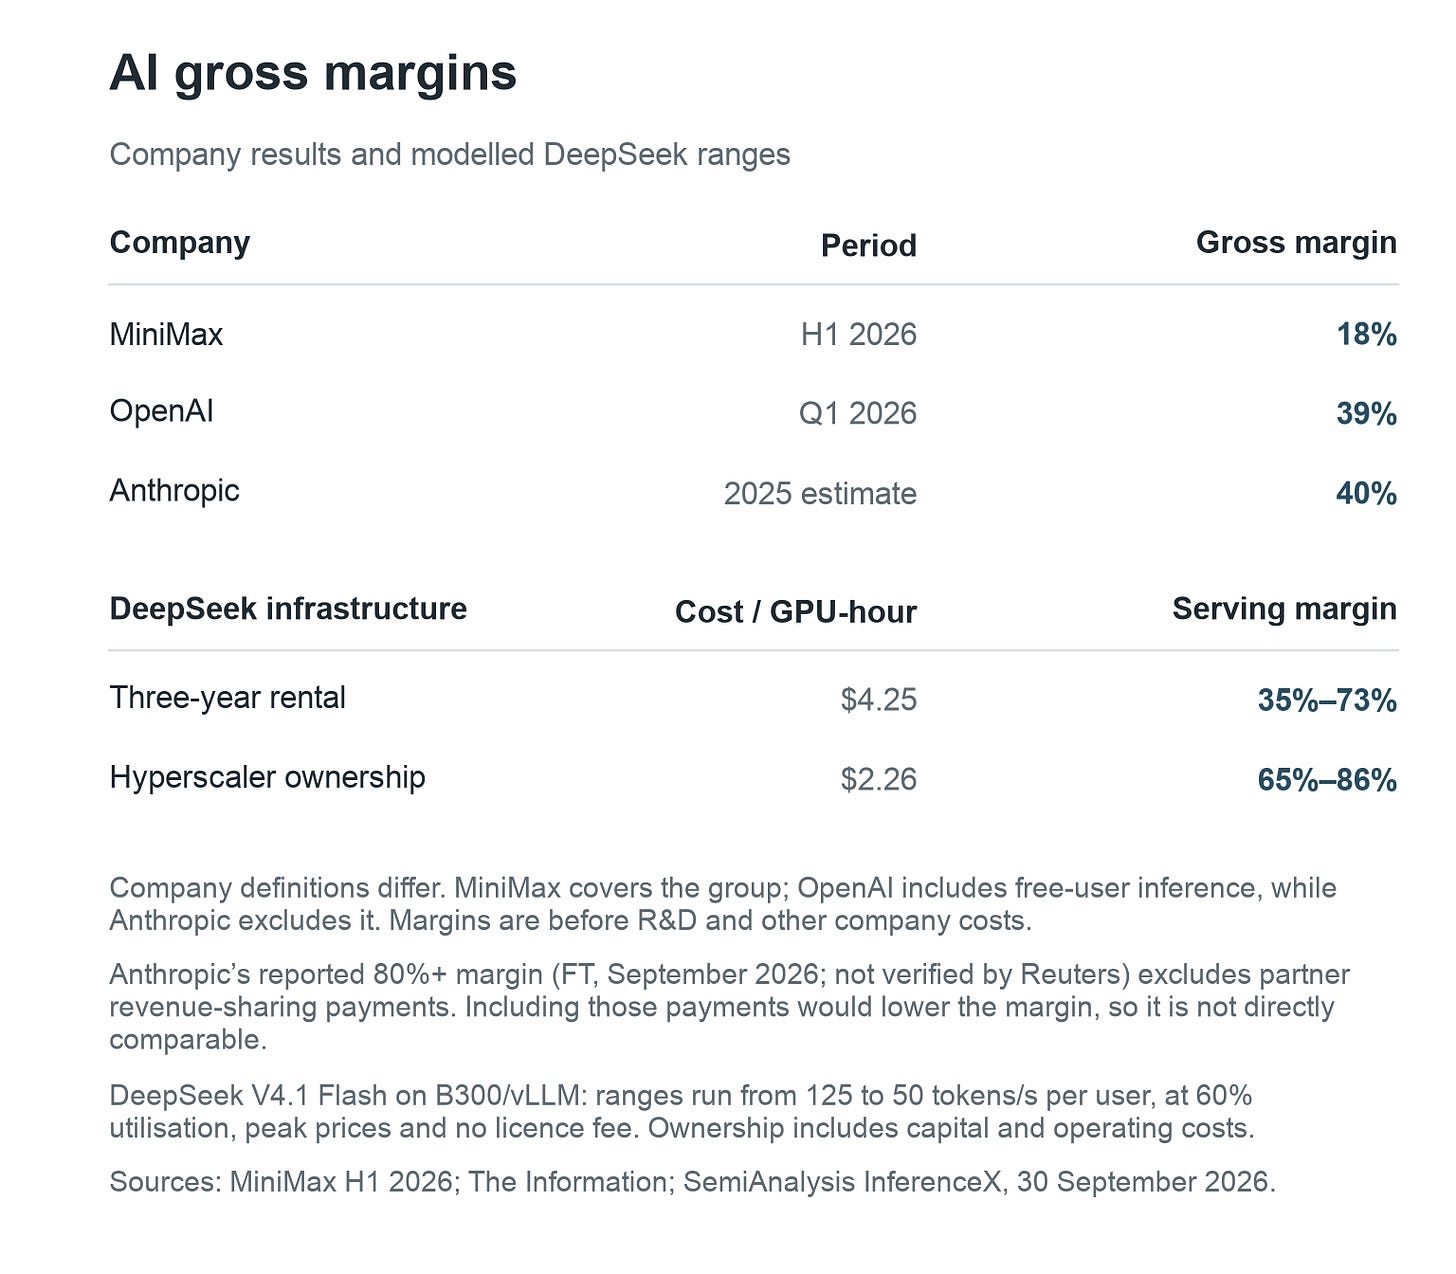
The DeepSeek comparison covers the cost of serving one workload. An AI company also has other bills to pay.
Some of the main things that move gross margins are:
-
What the hardware costs. SemiAnalysis puts a three-year rental at $4.25 per GPU-hour, versus $2.26 for ownership at hyperscaler scale. At faster speeds, ownership lifts the modeled margin from 35% to 65%.
-
How much of the capacity gets used. Both examples assume 60% utilisation. Hardware sitting idle still costs money, whether you own it or have committed to renting it.
-
How fast customers need answers. A GPU can serve more requests together if each user accepts a slower response. In the DeepSeek example, increasing speed from 50 to 125 tokens per second per user cuts the rental margin from 73% to 35%, at the same token prices.
-
What customers pay for the work. Using GPT-6 Sol’s prices and Artificial Analysis’s benchmark mix of fresh input, cached input and output, a million tokens brings in roughly $1.50. At an assumed 40% gross margin, $0.60 remains after direct costs.
-
A 20% price cut to $1.20, with direct costs unchanged, leaves $0.30: a 25% margin. If direct costs also fall 20%, the margin stays at 40%, but gross profit falls to $0.48 per million tokens. The same proportional fall leaves fewer dollars for salaries and model training. Paid usage has to rise disproportionately to cover the same bills.
-
With subscriptions, it is a race to offer more work for the same monthly fee. In SemiAnalysis’s June test, heavy use of $200 plans translated into thousands of dollars at API prices. And consumers now expect this level of usage from these plans. Providers can theoretically tighten limits or charge more (happening now with OpenAI’s new $500 plan and $200 plan limits being halved), but tight competition at the frontier means margins will stay under pressure.
-
Let’s use reported costs to see what comes next. OpenAI spent about $19 billion on R&D and nearly $6 billion on sales and marketing in 2025. Its plans soon get much bigger: in April 2026, the Wall Street Journal reported a forecast of $121 billion for training compute in 2028 alone.
The table below holds OpenAI’s 2028 $121 billion training bill against the 2030 $350 billion revenue target and varies the gross margin. This tests how much room the business might have for its other costs. It’s not a projected P&L given it’s line items use different years.
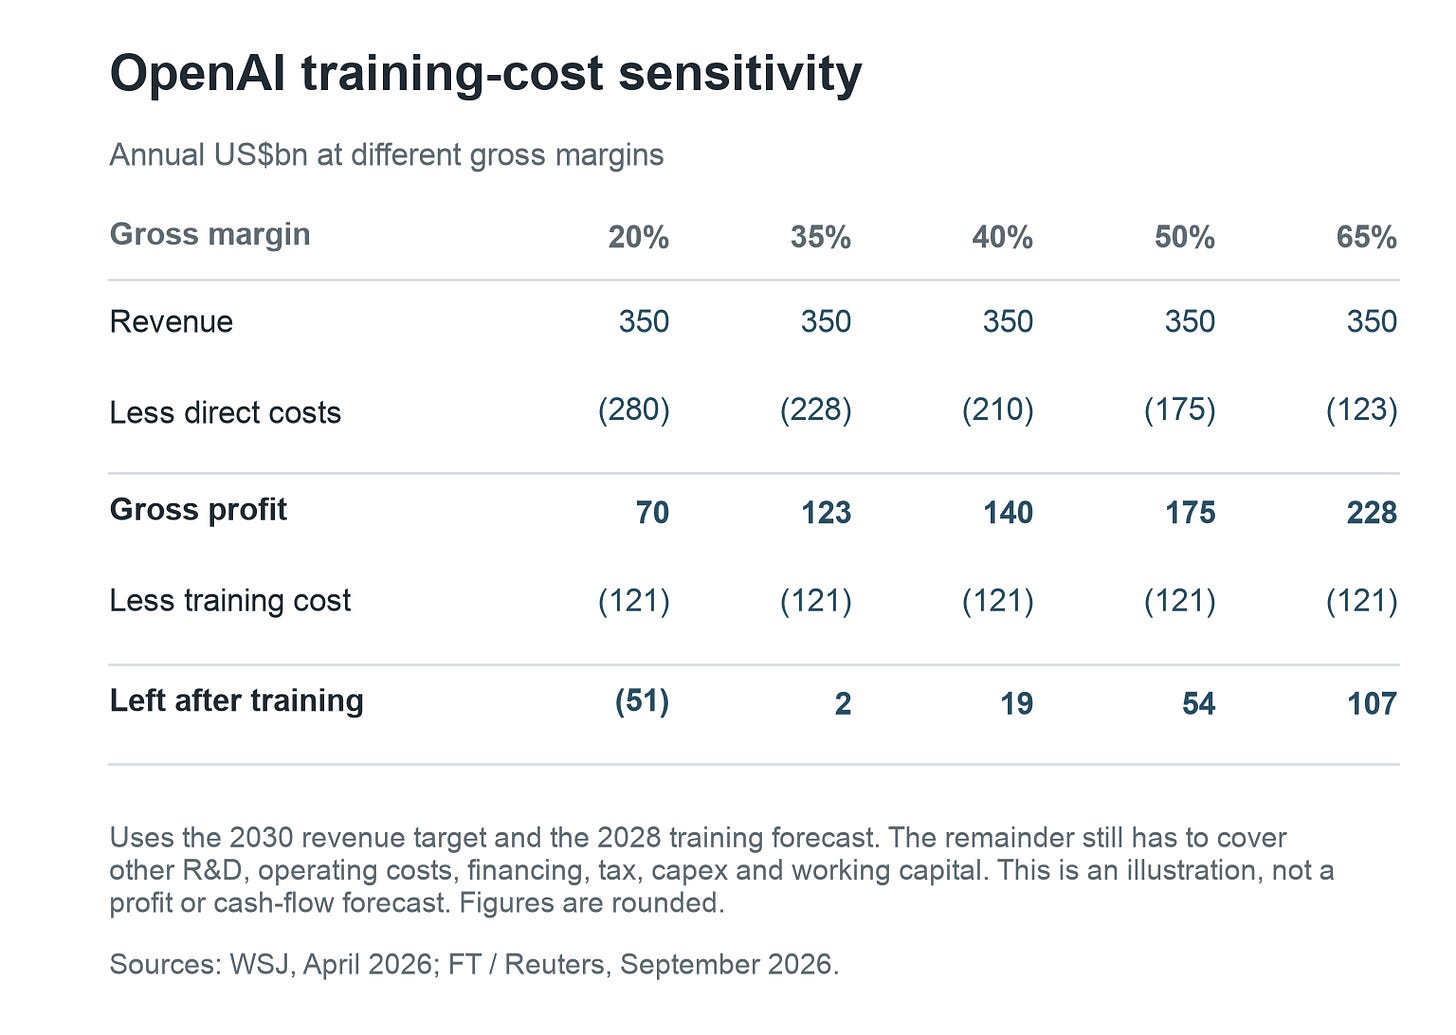
At a 40% margin, training leaves $19 billion for everything else. At 50%, there is $54 billion left.
This is before any operating expenses like salaries, marketing, and financing costs are paid.
MiniMax which recently IPO’ed makes this example less abstract.
-
In H1 26, it earned $117 million in revenue and spent $96 million delivering its products, leaving $21 million of gross profit.
-
Research and development cost $297 million, with another $57 million going to sales and administration.
-
Gross profit was able to cover just 7% of the research bill.
Better margins would help. At a hypothetical 65% gross margin, the same revenue would yield $76 million gross profit, still very short of $354 million operating expenses.
MiniMax needs revenue to grow much faster than the rest of its bills. Compared with the first half of 2025, revenue grew faster than R&D, but the dollar shortfall grew too.
To follow the cash, we have to use the 2025 accounts:
-
In 2025, MiniMax used $284 million after operations, asset purchases, lease payments and cash interest.
-
Loan repayments and other financing payments took the shortfall to $349 million.
-
It covered that through $426 million of preferred-share financing, $66 million of new borrowing and $73 million released from deposits and investments. You can’t keep doing this indefinitely.
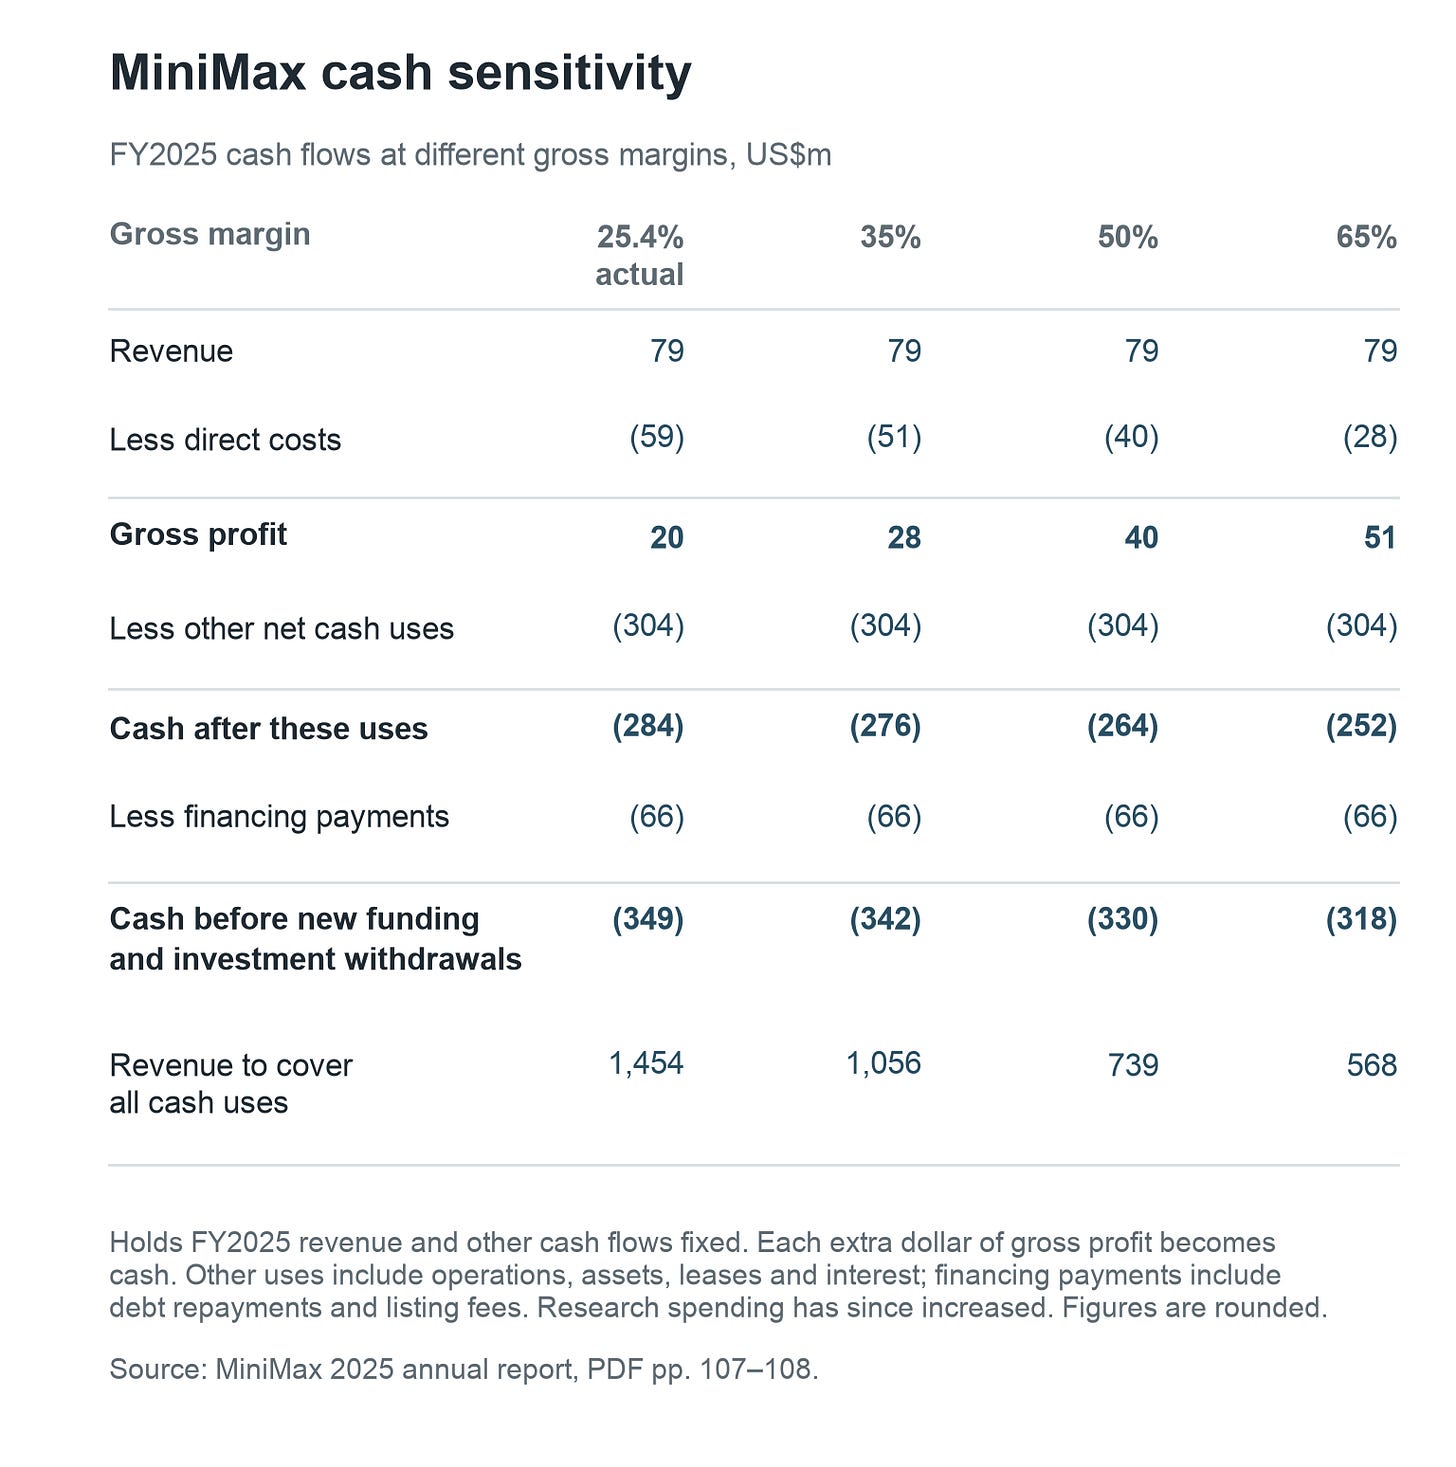
Minimax’s IPO bought it some (not a lot) of time.
-
MiniMax raised HK$5.29 billion in January and had used HK$2.94 billion of it by June: 56% of the IPO money in roughly six months.
-
That pace would use up HK$5.88 billion in a year, more than the entire IPO proceeds.
-
In July, it raised another HK$9.44 billion net from selling shares and HK$6.43 billion net from convertible bonds.
It also had $134 million of bank debt at June 2026 and issued HK$6.5 billion of convertible bonds in July, due in July 2027 unless converted into shares. 8
Financing buys time to improve these economics. However, the fundamentals still have to improve massively.
-
OpenAI announced a $122 billion round in March and is now raising at least another $30 billion after having to delay its IPO. HSBC’s older November 2025 model also found a massive funding gap despite strong customer growth.
-
Anthropic has committed at least $518 billion to suppliers over a decade, with about 80% non-cancellable or payable regardless of use. Nearly a quarter of its 2025 revenue came from just two customers, and many of its largest clients have no long-term contracts. Its planned IPO could raise up to $100 billion. A bank run risks depositors withdrawing money before the bank’s long-term loans are repaid. Anthropic faces a different and more acute version of the bank run problem without the stability of being a bank: customers can cut spending while years of supplier bills remain.
The scale of revenue and margin improvements needed from each of these companies is extremely large. Everyone needs hundreds of billions in revenue and is willing to spend trillions in compute. When you add these requirements up, the level of economy change needed in a short time is at a scale unseen before.
This is what makes me uneasy about the scale of the buildout. Companies are committing to years of bills while the prices customers pay and the cost of serving them are still changing massively.
Open weights models are taking more of the share of overall inference which puts revenue and margins for companies like OpenAI and Anthropic even more at risk.
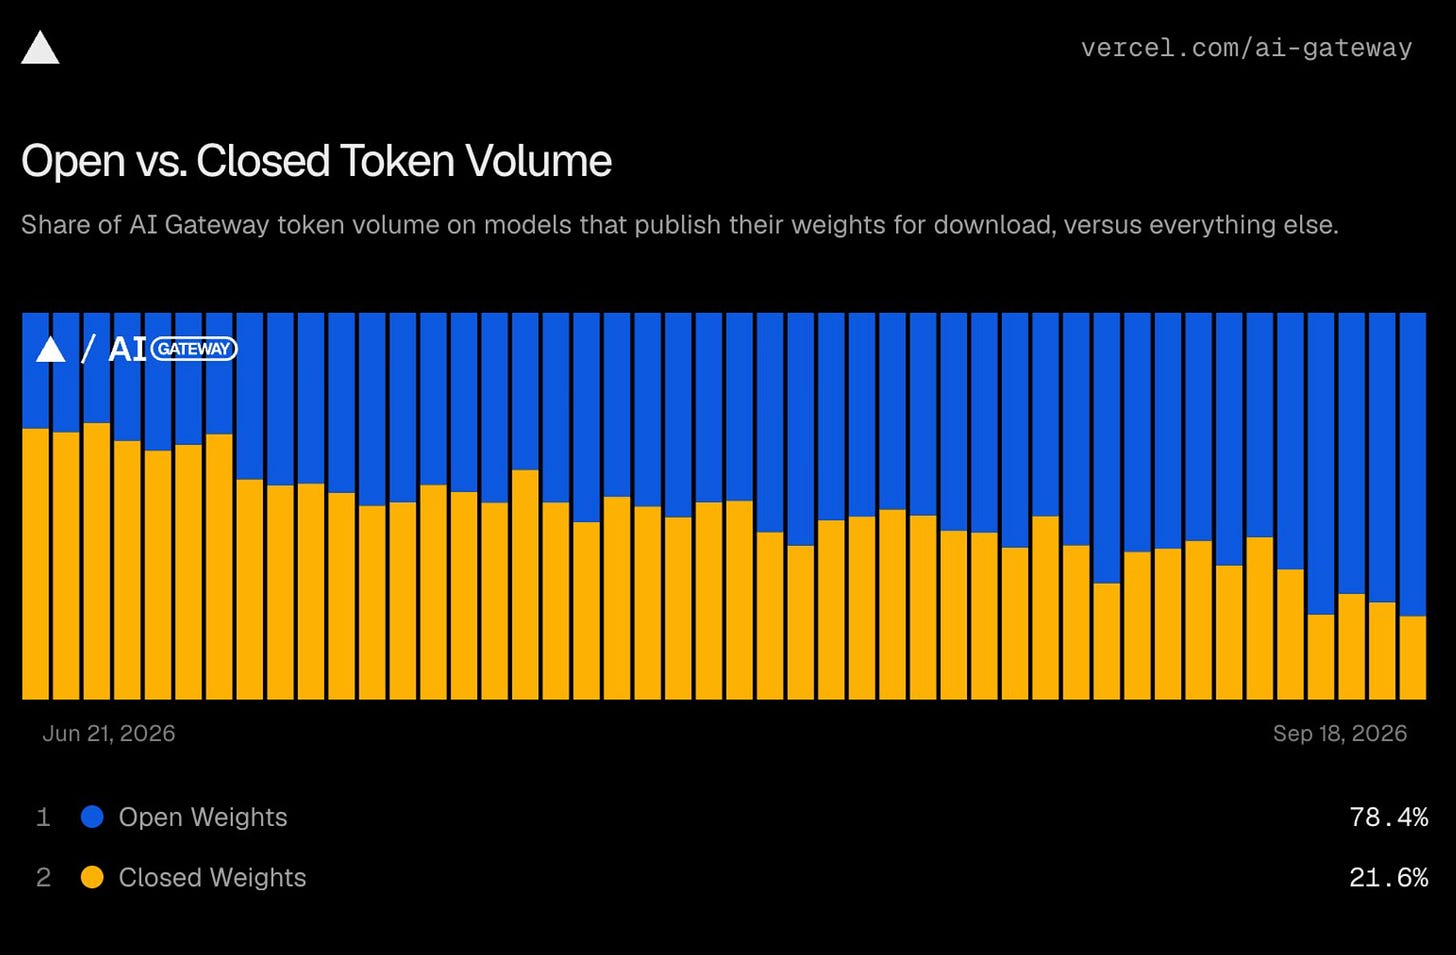
Cheaper AI could attract many more customers and bring enormous value to them, while the first wave of companies struggle to recover what they spent.
The history of the telecom boom and bust shows us exactly how this transpired in the past.
The telecom buildout left useful networks but wiped out shareholders
Iridium offered something remarkable in the 1990s: a phone that could reach beyond ordinary mobile coverage using a network of satellites.
But imagine paying around $3,000 for a bulky handset, then $2–7 a minute for calls, while ordinary mobile coverage and roaming were improving. Global coverage was valuable to some people. Not enough people were willing to pay that much for it.
There is a version of that risk for expensive frontier models too. If a cheaper open-weight model does the job, how many customers will pay for the extra capability?
Iridium’s system cost about $5.7 billion. By March 1999, it had roughly 10,000 subscribers against a 52,000-subscriber requirement in its loan agreement. It filed for bankruptcy that August, less than a year after launching commercial service.9
A new owner acquired the operating assets for $25 million in 2000 and secured a US government customer. It still needed to reduce costs and grow the business, but it had a much smaller investment to recover.10
Buying a network for $25 million is a very different financial proposition from building it for $5.7 billion. There is a related difference with AI labs.
A frontier lab pays to discover new capabilities, including the experiments that fail. A competitor can build on that work: adapting existing models, using published research, or training on another model’s answers through distillation.
It still has development and running costs, but has much smaller research capex to recover. The frontier lab has to earn back the cost of discovering what works while competing with companies that spend significantly less to reproduce it.
Global Crossing built fibre-optic networks to carry internet traffic. Demand was growing, but the industry built so much capacity that the price of carrying that traffic collapsed.
On the New York–Los Angeles route, TeleGeography reported that the annual price of leasing the same amount of bandwidth fell from about $1.8 million in 2000 to less than $150,000 in early 2002. A supplier facing that price cut would have needed to sell more than twelve times as much capacity just to keep revenue unchanged.11
Right now, AI companies are racing to add capacity. But will customers pay enough to make all of it profitable once it arrives? If token prices fall faster than serving costs, even growing usage may leave too little money to pay for research and recover the initial investment on a reasonable time horizon.
Global Crossing filed for bankruptcy in 2002. Its old shareholders received nothing under the reorganisation, while the network continued under new ownership. Parts of the original cable system remained useful.12
And so, similar to the fibre optic buildout, AI buildout can be extremely useful and pervasive while still bankrupting some the companies that funded it initially.
We should still keep building AI for the extraordinary lives it will make possible
After all these calculations, I still want us to keep building AI.
I want us to cure diseases that kill people today, make dangerous and exhausting manual work unnecessary, and give people more time to spend on the things they love. AI gives us a serious chance of doing those things so it’s worth spending money on.
Robert Gordon’s The Rise and Fall of American Growth describes what progress on that scale looks like. Running water freed people from carrying buckets into their homes. Electric appliances took over hours of household work. Sanitation and medicine helped children survive and adults live longer. For the people who gained them, these inventions changed what an ordinary life could be. I want us to be that ambitious about the coming centuries.13
We already have reasons to be. In 2022, DeepMind and EMBL-EBI made AlphaFold’s predictions for the structures of more than 200 million proteins freely available to researchers. A protein’s shape helps determine what it does, so these predictions help researchers investigate disease and look for treatments.
Insilico Medicine has used AI to help identify a drug target and design a treatment for pulmonary fibrosis, a disease that progressively scars the lungs. In a small trial published in 2025, the group receiving the highest once-daily dose gained lung capacity on average, while the placebo group lost it. Larger, longer trials are needed to establish whether that improvement lasts.14
That ambition extends to energy. DeepMind and the Swiss Plasma Center have used AI to control superheated plasma inside an experimental fusion reactor. DeepMind is now working with Commonwealth Fusion Systems to simulate and improve how its SPARC machine will run. These are early steps, with difficult engineering still ahead. But imagine what cheap, abundant clean electricity could make affordable: turning seawater into drinking water, cooling homes through dangerous heat, or powering factories without burning fossil fuels.15
There is progress in physical work too. In a ten-month pilot at BMW’s Spartanburg plant, Figure’s humanoid robot moved more than 90,000 sheet-metal parts for car production. It performed a repetitive task BMW describes as physically exhausting. I want that capability to become cheap and versatile enough to take over the work that wears people’s bodies out, and eventually the chores that fill so much of everyone’s day.16
I question whether these gains will arrive fast enough to repay today’s investors. A treatment developed twenty years from now could save millions of lives without rescuing a company that ran out of cash in a decade. Patients, researchers and consumers could gain enormously from cheaper AI while its suppliers struggle to earn the revenue assumed in their plans. Paul Graham made a related argument after the dot-com crash: the excesses of the boom could coexist with a technology whose greatest effects were still ahead.17
I remain skeptical of the scale and timing of this buildout. Some of the companies financing it might go bankrupt, and a bust would do some damage to financial markets (as they always do).
But I still want to live in the world we will build with it.
McKinsey’s data-centre spending scenarios (April 2025); Goldman Sachs’ AI infrastructure spending scenarios (May 2026); Dwarkesh interview with SemiAnalysis’ Dylan Patel (August 2026). McKinsey’s $7.9tn is its high-demand case ($5.2tn central); the estimates differ in scope and timing.
Bain’s 2026 Technology Report: the $6tn AI revenue requirement.
BEA, US GDP in 2025; Destatis, Germany’s GDP in 2025; ECB, annual EUR/USD exchange rate.
Uber Engineering on uReview, its AI code-review system.
Anthropic Institute, Economic Scenarios for Transformative AI (September 2026), Table 3. The 16.7% final-year rate converts the model’s log growth rate to an ordinary percentage change. The five-year extension is our assumption.
Bureau of Labor Statistics, US employment; World Bank, US real GDP.
University of Michigan sentiment data; University of Michigan historical sentiment chart.
MiniMax financial statements and financing disclosures: 2025 annual report, PDF pp. 8, 107–108, 132 and 149; H1 2026 results, pp. 4–8 and 14–15; July financing terms and IPO utilisation, pp. 12, 15 and 25; completed July financing, p. 2. The H1 results cover the whole group and omit a cash-flow statement. IPO proceeds used are not a measure of recurring cash burn.
MIT’s Iridium case study; court findings on its loan covenants.
Motorola’s filing on the asset transfer; purchase terms and the government contract are in the MIT case above.
TeleGeography’s April 2002 report announcement.
Global Crossing’s reorganisation filing; the 2010 upgrade to its AC-1 network.
Robert Gordon, The Rise and Fall of American Growth, chapter 1.
EMBL-EBI’s 2022 release of 200 million AlphaFold protein structure predictions. Xu et al., rentosertib phase 2a trial, Nature Medicine (2025): 71 patients randomised across four groups over 12 weeks; lung function was a secondary endpoint.
DeepMind and the Swiss Plasma Center on AI control of fusion plasma (2022); DeepMind’s research partnership with Commonwealth Fusion Systems (October 2025).
BMW’s results from Figure 02’s ten-month factory pilot (February 2026).